Treasury bonds appear ready to break beneath their previous low, but the larger pattern suggests price is seeking a platform to support a bounce. This should provide both short and long opportunities for traders working on time frames ranging from days to months.
Although 30-year bond futures have already poked below the October 2022 low, the iShares 20+ Year Treasury Bond ETF (NASDAQ:TLT) hasn’t yet broken beneath its corresponding level. We expect it will try again very soon. The event will probably bring more bears into the market, and the nimble ones might turn a profit.
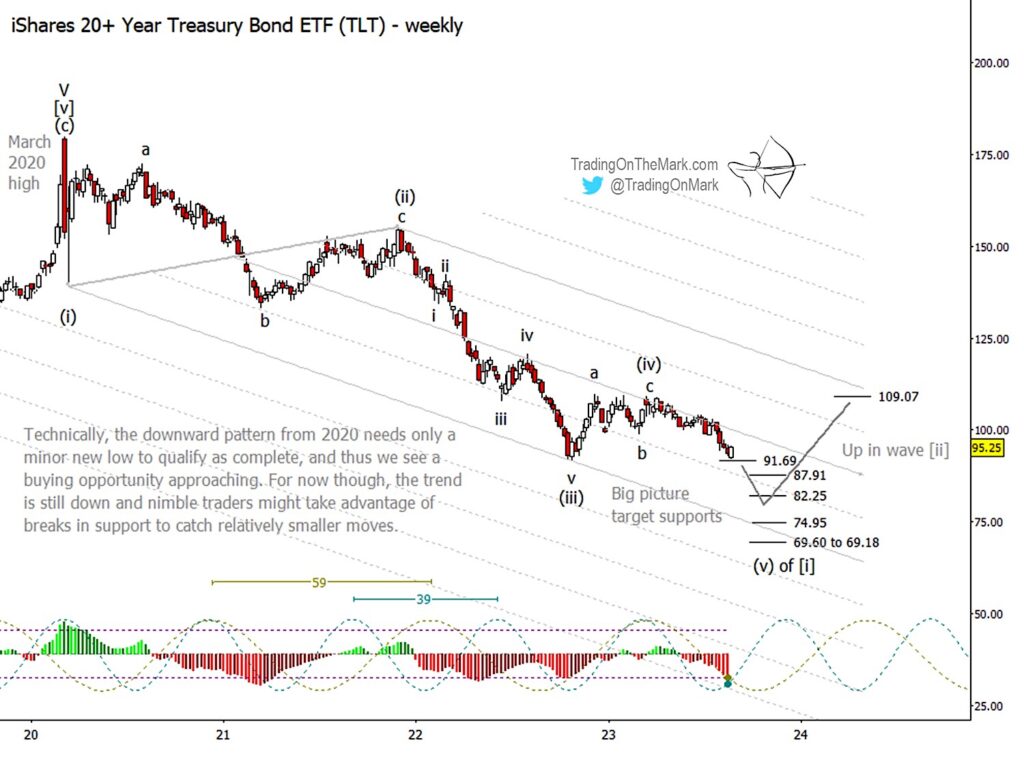
In the bigger picture, TLT appears to be working on the fifth and final wave of an impulse down from the 2020 high. Technically any new low beneath 91.85 would qualify the downward pattern as complete, but it’s also possible that wave (v) can extend lower before the entirety of wave [i] is finished.
Among the support levels shown on the weekly chart, we note that 87.91, 92.25 or 74.95 could coincide with channel geometry to provide footing for a wave [ii] bounce. That’s the buying opportunity that should appeal to traders working on weekly or monthly time frames. The wave [i] low could even happen in the 69.60-69.18 range if the current decline continues into 2024, although we believe the turn will probably occur sooner than that.
Meanwhile, traders working on faster time frames might use a break of 94.08 as a signal that price is ready to attempt a cascade down through some of the support levels shown on the daily chart.
At this stage in the pattern, bears really must be skilful. By our analysis, the next downward move will represent wave [V] of ‘v’ of (v) of [i]. The move could extend for a considerable distance downward, or it could find support nearby.
If bears are fortunate enough to see a downward cascade, then they can try to use the break of each support level on the daily chart to aim for the next level down. For example, a break of 94.08 makes it possible to try for 90.00, and so forth.
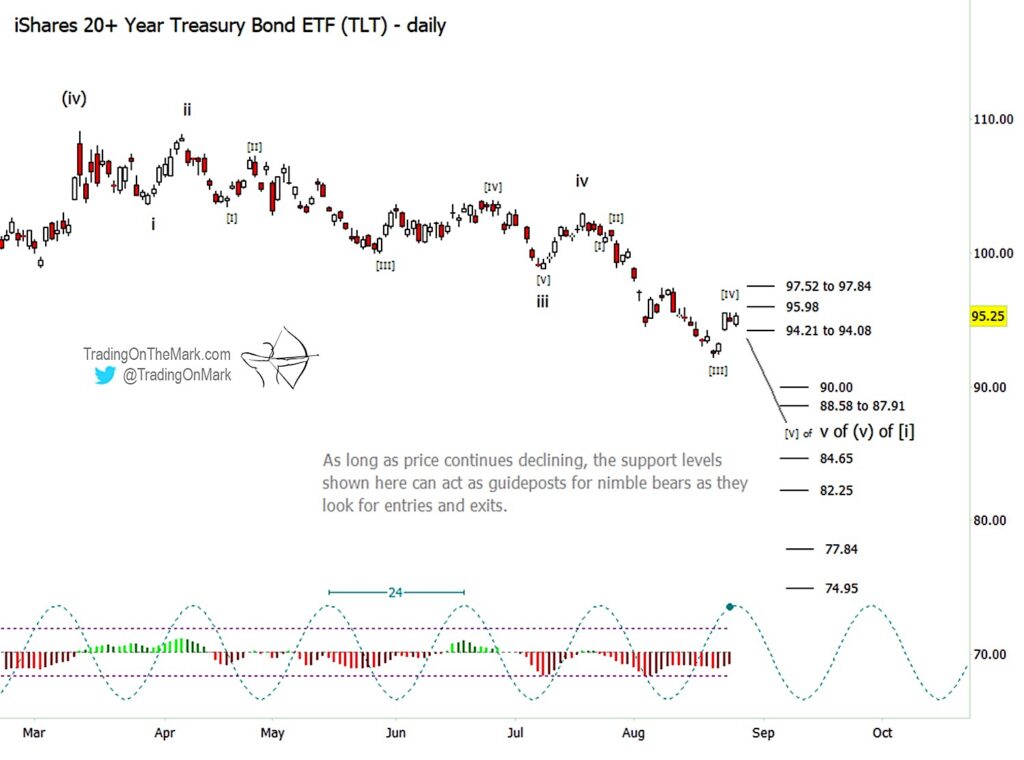
Going forward we recommend watching for divergences and other signals coming from momentum indicators that can warn of the downward move reaching completion. Judging by the 24-day cycle shown on the faster chart, that low could arrive as early as September.
Trading On The Mark uses technical analysis to identify the trends and turns in highly traded markets for commodities, energy, currency, bonds and indices. Visit their website for more charts, and follow Trading On The Mark on Twitter for updates and special offers.
Twitter: @TradingOnMark
The authors may have a position in the mentioned securities at the time of publication. Any opinions expressed herein are solely those of the author, and do not in any way represent the views or opinions of any other person or entity.
Editor’s note (8/28/23 at 8:51pm CDT): Corrected “NYSEARCA” to “NASDAQ” for proper attribution of stock ticker.


