The Elliott wave forecast we posted about the Treasury Bond ETF in February is still working even though price hasn’t yet put in the strong downward move we are expecting.
With this week’s FOMC meeting, it makes sense to take a fresh look at the resistance areas that should hold and the supports that need to break in order to confirm the downward forecast.
Treasury Bonds Elliott Wave Trading Outlook
As with our Elliott wave count for bond futures, the chart for the iShares 20+ Year Treasury Bond ETF (NYSEArca: TLT) shows the scenario where the major top was reached in mid-summer 2016.
Even though the upward diagonal form appears complete, price has not yet fallen out of the multi-year channel that defined the diagonal.
Over the weekend we tweeted the monthly TLT chart that’s shown below. When price eventually breaks, the next main Elliott wave price target area should be close to the bottom of the channel, and we can narrow in on the best target area by measuring the relationships among the smaller waves.
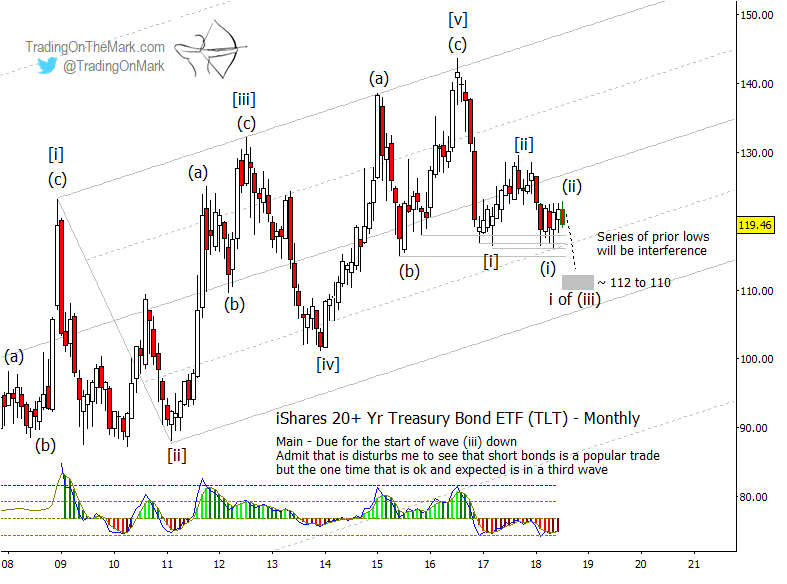
When the downward move kicks in, the first challenge will be to break the supports represented by prior lows that held from 2015 into the current year. We have drawn those support lines on the monthly TLT chart above. The first set of major Fibonacci supports based on measurements with a monthly chart are roughly in the area from 112 to 110.
Note that if the downward wave begins extending, as we expect, then the first support area will just be a “stepping stone” where TLT can pause without any large upward retrace.
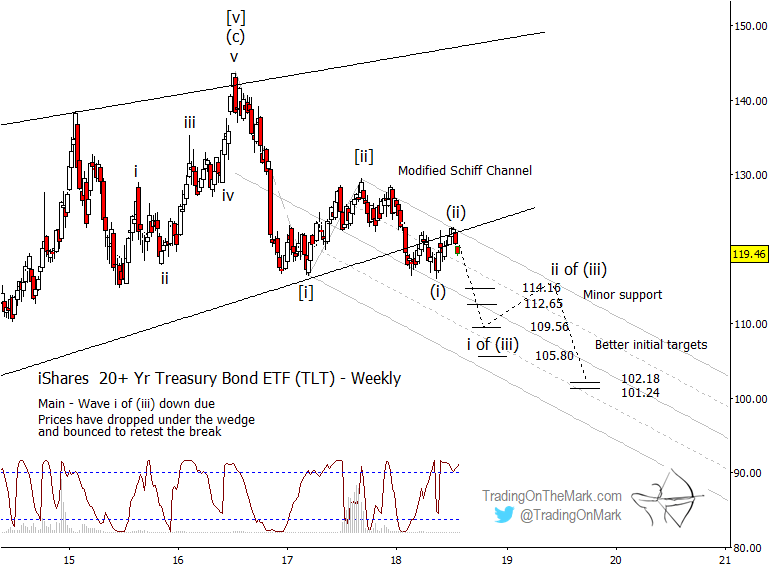
On a weekly chart, price broke underneath the most prominent supporting trend line earlier this year and has retested it several times from below. There is also resistance nearby from the upper boundary of the new downward-pointing channel.
If resistance continues to hold, then finer-grained price targets include minor supports at 114.16, 112.65, and more important ones at 109.56 and 105.80. The lower one of those actually lies beneath the big channel shown on the monthly chart, so It might not be visited until after price has attempted an upward retracement from 109.50. (The exact path drawn forward is speculative – an educated guess.)
Lower supports at 102.18 and 101.24 are based on larger Fibonacci measurements, and they represent viable targets for wave ‘iii’ of (iii).
With morning and evening updates every trading day, Trading On The Mark offers charts and analysis on time frames ranging from weekly to intraday for the S&P 500, crude oil, the Euro, Dollar Index, treasury bonds, and gold.
This summer, we’re making a special offer available for extra savings. Take out a year-long subscription to our Daily Analysis service and we’ll deduct the cost of three months of service. Basically you get a whole summer of charts for free! The coupon code to take advantage of this offer is “summer”.
Twitter: @TradingOnMark
The authors may have a position in the mentioned securities at the time of publication. Any opinions expressed herein are solely those of the author, and do not in any way represent the views or opinions of any other person or entity.


