Talk about a roller coaster ride for investors. This past week was nothing short of exasperating for the masses. The S&P 500 fell 1.6% on Monday, rallied 1.4% on Tuesday, and then dropped 1.1% on Wednesday after what looked like a very nice breakout in the morning. Thursday was dicey before firming up into the close. And then on Friday, the S&P 500 opened up by 1.1% before rolling over to the downside and then finally surging, finishing the day with a 2.48% gain and the largest one-day lift since September 8.
And they say the weather people have a tough job. Here’s a technical overview and stock market outlook for the S&P 500 and Russell 2000 this week.
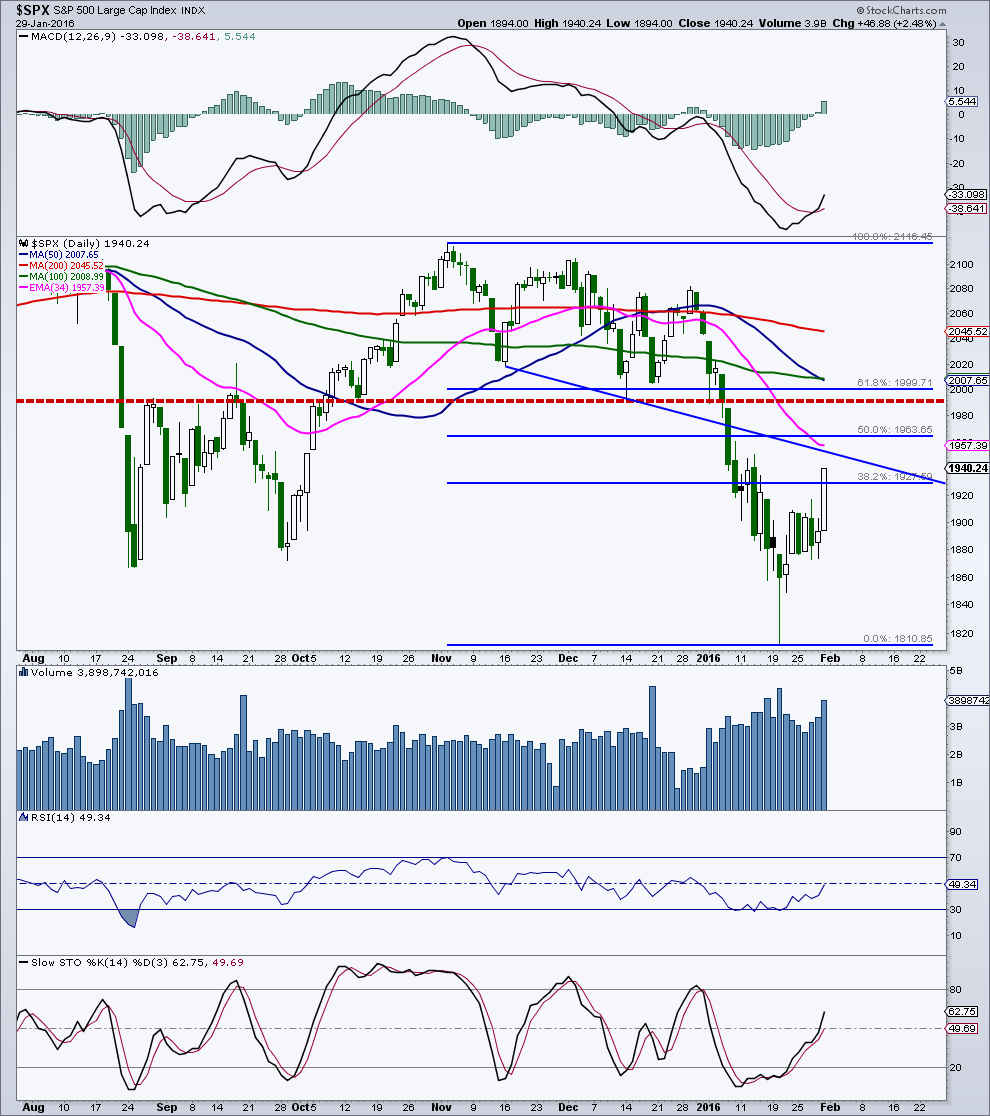
S&P 500 Index – A Bear Market Rally?
Over the past couple of weeks, I have written about the possibility of a very good counter trend rally that could potentially take the “500” up near the last major breakdown level of 2,000. The 1,980 to 2,005 price region is loaded with potential pieces of technical resistance so I don’t see any rally busting through that zone. This area has represented both support and resistance many times over the past year so it has great importance.
Two other notable price confluences in this area:
- The 61.8% Fibonacci retracement of the decline since late December also targets this zone.
- The declining 50-day and 100-day moving averages are also in this area.
I have also noted potential Fibonacci retracement targets including a 38.2% take back at 1,928 and a 50% retracement target up at 1,964.
The “500” blasted through the 1,928 zone Friday so next up on a FIBO basis is 1,964. That type of speed and disregard could be indicative of a fierce bear market rally. Note that trendline resistance comes in at 1,950 (looking out a couple days), while the flattening 34-day exponential average is at 1,957. The 34-day stopped the index after the initial rally off the August bottom.
I have noted several times here and to my premium subscribers that there is a virtual absence of major price support and resistance on the S&P 500 chart between 1,820 and 2,000. In other words, price has moved through this region very fast and on numerous occasions and that fits perfectly with the possibility of a ferocious bear market rally.
If this is a bear market rally, there should only be a three wave advance or an ABC move higher. It appears that A and B are complete and we are in the final move higher or C. If C=A, then this last rally should stop up near 1,970. Just another possibility.
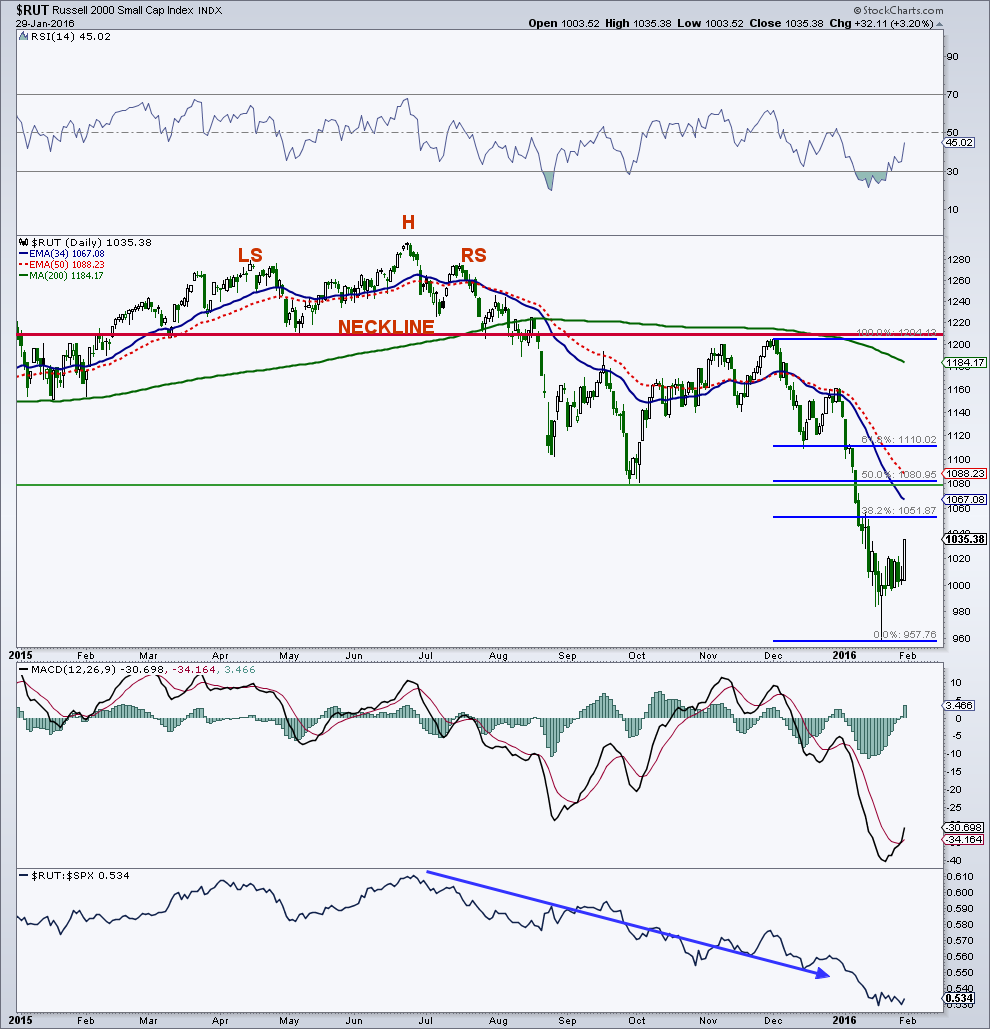
Russell 2000 Index
The Russell 2000 remains in a much weaker technical condition than the S&P 500 and has been lagging the large cap index for seven months. The big upside level for the small cap index is the 1,080 area or the last breakdown level. If the stock market continues higher in the coming week(s), this price point may represent the top of the current counter trend rally before the next leg of the bear market takes hold. The 1,080 level also represents a 50% retracement of the latest decline and the declining 50-day exponential average (also potential resistance) is closing in on this region.
You can contact me at arbetermark@gmail.com for premium newsletter inquiries. Thanks for reading.
More From Mark: Will Warning Signs Trigger Bear Market For Stocks In 2016?
Twitter: @MarkArbeter
The author does not have a position in any mentioned securities at the time of publication. Any opinions expressed herein are solely those of the author, and do not in any way represent the views or opinions of any other person or entity.


: Showing Some Signs of Emerging Strength")
