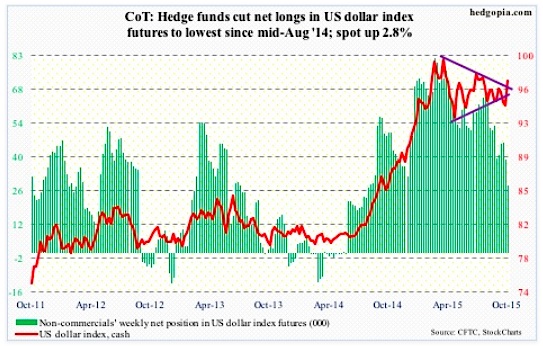
US Dollar Index: Post-Draghi comments on Thursday, euro’s loss was dollar’s gain. The US Dollar Index, which assigns 57.6-percent weighting to the euro, surged 1.5 percent in that session. With the Thursday move, in one swoop, the US Dollar Index recaptured 50- and 200-day moving averages. It rallied further on Friday, and is now just under the daily upper Bollinger band.
Non-commercials continued to reduce net longs in the dollar, but this was prior to the Thursday-Friday move in the US Dollar Index, which has broken out. Let us see if these traders will join the bandwagon.
COT Report data: Currently net long 28.2k, down 10.7k.
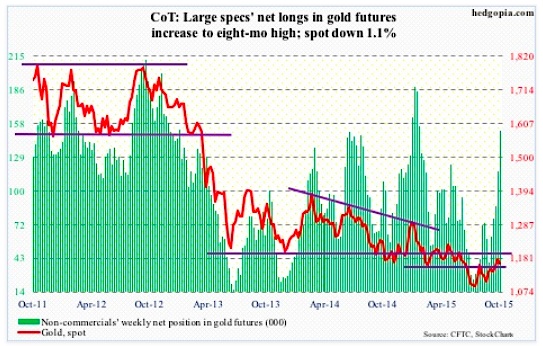
Gold: News of possible additional stimulus in the Eurozone and the easing in China was no help to gold prices. A case of once bitten, twice shy? Despite all the liquidity sloshing around globally and constant central-bank talk that they would like higher inflation, the latter is a no-show. Precious metals sensed this as early as four years ago. Gold prices peaked in September 2011, shortly after QE2 (in the U.S.) ended, and never got going once QE3 got underway in September 2012.
Or it may just be a case of technicals taking over. Gold had rallied seven percent in 11 sessions ended last Thursday, closing the week right near resistance. Overbought as it was, come Monday, gold was not able to save its 200-day moving average. On Friday, it opened up reacting to the China news, but the initial strength was sold right off the bat.
Support at $1,140-ish could be in play neat-term. The corresponding support on GLD, the SPDR Gold ETF, is on $110-ish.
In the meantime, non-commercials continue to add to net longs of gold.
COT Report data: Currently net long 151.3k, up 34.1k.
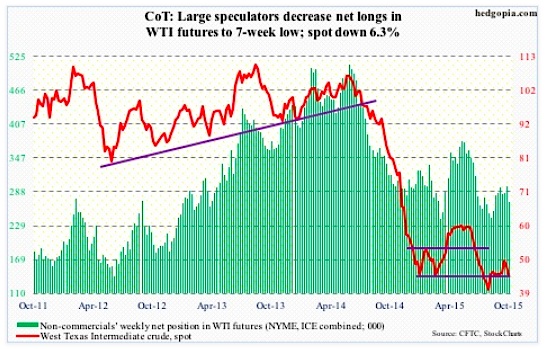
Crude Oil: Spot West Texas Intermediate crude oil fell six-plus percent for the week. News on the inventory front was out-and-out bad.
This is a little old, but Saudi Arabia’s crude oil stocks were at a record in August – at 326.6 million barrels, up 6.4 million barrels from July. Total oil production was 10.27 million barrels per day, down from 10.36 mb/d.
Here at home, in the week ended October 16, crude oil inventory increased by another eight million barrels, to 476.6 million barrels. In the prior week, stocks shot up by 7.6 million barrels. With the latest increase, inventory is now the highest since the May 29th week. It peaked at 490.9 million barrels in the April 24th week.
On the positive side, gasoline stocks fell by 1.5 million barrels, to 219.8 million barrels – now down 4.1 million barrels in two weeks. As well, refinery utilization ticked up, to 86.4 percent from last week’s 86 percent. Utilization has dropped nearly 10 percentage points from 96.1 percent in the August 7th week. Last but not the least, oil production was unchanged at 9.1 million barrels a day; it peaked at 9.61 mb/d in the June 5th week.
Technically, spot WTI was not able to save support at $47-$48, and on Friday lost the 50-day moving average ($45.05). Support at $43-ish is a must-hold.
COT Report data: Currently net long 269.9k, down 28k.
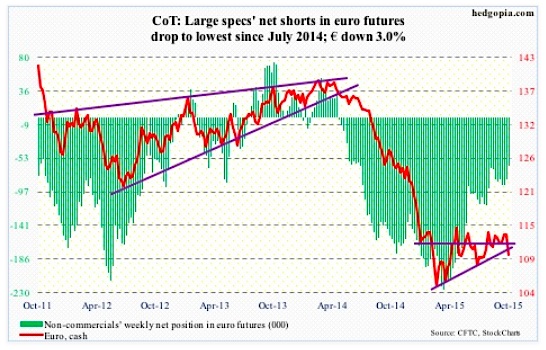
Euro: The euro slumped two percent on Thursday, slicing through both 50- and 200-day moving averages, and another 0.8 percent on Friday. Mr. Draghi got what he probably wanted – a weak currency.
Speaking to the press following the ECB meeting, he said the bank is “ready to act if needed.” This is nothing new. He has expressed similar language in the past.
In addition, he also said that the bank is prepared to provide additional stimulus to raise inflation to its target, probably as soon as December. He is clearly not happy with the trend in inflation. Annual inflation went negative in September in the Eurozone. Mr. Draghi said there is a high degree of correlation between headline inflation and inflation expectations; when the latter drops, real rates go higher. The solution, in their eyes, lies in more liquidity. The strategy has not helped the economy much, but stocks sure like it. On Thursday, the DAX surged 2.5 percent and the CAC 2.3 percent, just to name two indices.
This week’s action saw the Euro breaking a seven-month rising trend line.
COT Report data: Currently net short 62.6k, down 18k.
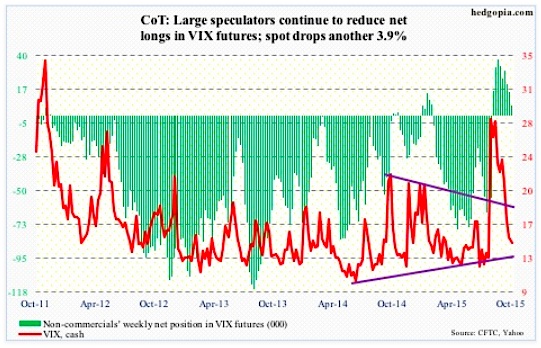
VIX: The spot Volatility Index (VIX) gave back another 3.9 percent during the week, but this was the first time in four weeks the VIX managed to close off the lows, dropping to a 13 handle on Friday before rebounding.
The spot VIX remains way oversold on a daily basis, and needs to clear the 200-day moving average (16.56) before a genuine rally in volatility can be launched.
COT Report data: Currently net long 7k, down 8.6k.
Thanks for reading.
Twitter: @hedgopia
Read more from Paban on his blog.
No position in any of the mentioned securities at the time of publication. Any opinions expressed herein are solely those of the author, and do not in any way represent the views or opinions of any other person or entity.


