The following is a recap of The COT Report (Commitment Of Traders) released by the CFTC (Commodity Futures Trading Commission) looking at futures positions of non-commercial holdings as of October 20, 2015. Note that the change is week-over-week.
10-Year Treasury Note: At the press conference following the ECB meeting on Thursday, when asked by a WSJ reporter as to why the bank is fighting low inflation which benefits consumers, Mario Draghi, ECB president, said inflation increases the real value of debt. There you go! A forthright answer from a central banker.
Disinflation/deflation hurts debtors. Inflation is one way to effectively reduce the debt load.
In the U.S., for example, federal debt stood at $18.2 trillion in 2Q15, up from $5.7 trillion 15 years ago. A little bit of inflation will go a long way. As do low interest rates. Interest payments of the federal government were only $457 million (at a seasonally adjusted annual rate) in 2Q15, versus $356 million in 2Q00.
U.S. interest rates will remain suppressed. Particularly so near-term based on what came out of the ECB as well as the People’s Bank of China this week.
Mr. Draghi hinted that additional stimulus might be on the way (more below). A day later, the PBoC cut its benchmark lending rate and reserve requirements for banks. It seems the liquidity punch bowl is being reloaded at least in two major economies, if not globally.
While this may be good for risk-on assets – duration notwithstanding – the fact remains that monetary measures continue to struggle to produce the desired results. Since November last year, this is China’s sixth rate cut. The economy is losing momentum, and prices are slumping.
Amidst all this, it will be difficult for the Fed to maintain a hawkish stance when it meets next week.
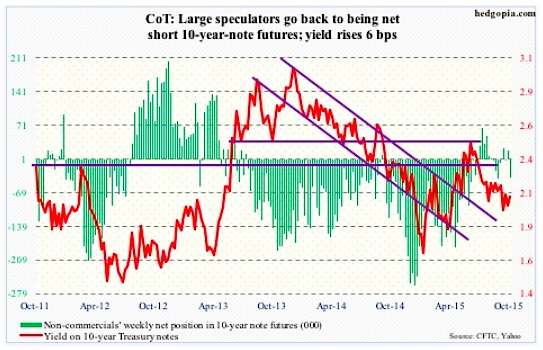
COT Report data: Currently net short 37.8k, up 55.5k.
30-Year Treasury Bond: Next week’s major economic releases are as follows.
New home sales for September are published on Monday. This will be coming on the heels of this week’s three housing-related releases, which were all good. Sales of existing homes in September were 5.55 million units at a seasonally adjusted rate, up from 5.3 million in August… September’s housing starts were 1.21 million units (SAAR) – the highest since October 2007… And the NAHB housing market index (builder sentiment) came in at 64 in October, a 10-year high.
Year-to-August, sales of new homes have come in north of 500,000 units (SAAR) in six of eight months, with the 12-month running average of 499,000 in August – the highest since 502,000 in November 2008.
Tuesday, FOMC meeting begins, and concludes the following day. There is no press conference by the Federal Reserve Chair. The next one does – the December 15-16 meeting is the last one this year.
The advance report on durable goods for September will be released on Tuesday as well. This series has lost momentum. Orders for non-defense capital goods ex-aircraft, a proxy for business capital expenditures, have contracted year-over-year for seven consecutive months.
Thursday, we will learn how the economy fared in the third quarter. This will be the advance estimate. The consensus expects real GDP growth of two percent. The economy grew 3.9 percent in the second quarter. The Atlanta Federal Reserve’s GDPNow model is forecasting (as of October 20th) a 0.9-percent growth. Despite its brief history, the latter does have a good forecasting record.
Also on Thursday comes out the pending home sales index. August was 109.4, down from 110.9 in the prior month, and 112.3 in May.
Friday is busy – on tap are personal income for September, employment cost index for the third quarter, and the University of Michigan’s consumer sentiment for October (final reading)… In August, core PCE was up 1.3 percent. This is the Fed’s favorite measure of inflation. The last time it rose at two percent was in April 2012… In the second quarter, private-sector wages and salaries increased 2.2 percent year-over-year, benefits 1.4 percent, and total comp 1.9 percent…October’s preliminary reading of consumer sentiment was 92.1, up from 87.2 in September. January’s 98.1 was an 11-year high.
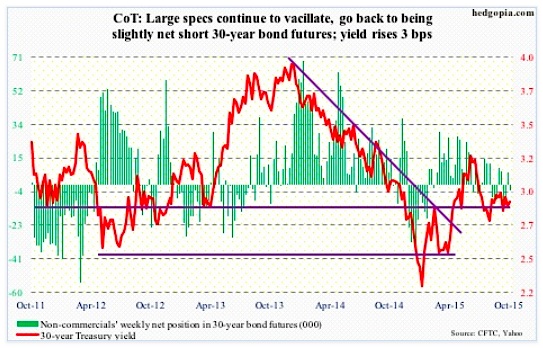
COT Report data: Currently net short 3.2k, up 9.9k.
E-mini S&P 500: In the week ended Wednesday, U.S.-based equity funds attracted $4.3 billion – the second straight weekly inflows. In the prior week, inflows were $2.5 billion. This looks good on the surface, but consider this: since the September 29th intra-day low, the S&P 500 has rallied 10 percent. During this period, on a cumulative basis, $2.1 billion has left these funds.
Shorts are probably getting creamed. There is no other way to explain the sharp move in stocks. At the end of September, NYSE Group short interest was the highest since July 2008; on the SPDR S&P 500 ETF (SPY) it surged 58 percent in six months.
Add central-bank activism to the mix, and low 3Q15 earnings expectations. As of October 22nd, operating earnings estimates of S&P 500 companies stood at $28.28 (courtesy of S&P). They were $34.74 at the end of 1Q14, and $31 as early as February this year.
With 34 percent of the S&P 500 companies reporting, 77 percent are beating on the bottom line. No surprise there, given the persistent downward revision. But only 43 percent are beating on the top line (courtesy of FactSet). Fortunately for stocks, revenue is not where the current investor focus is.
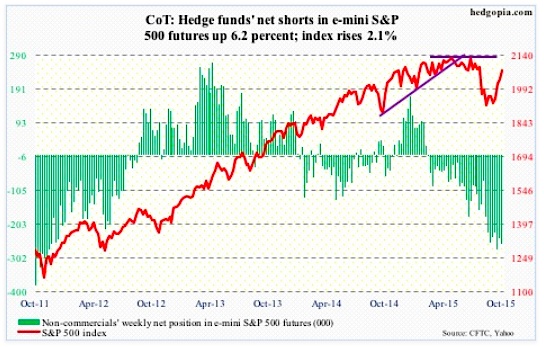
Non-commercials added to net shorts, but this was before the 2.8-percent rally in the S&P 500 in the last two sessions. Will the recent wave of buying in the stock market change things?
COT Report data: Currently net short 259.5k, up 15.1k.
continue reading about the COT Report on the next page…


