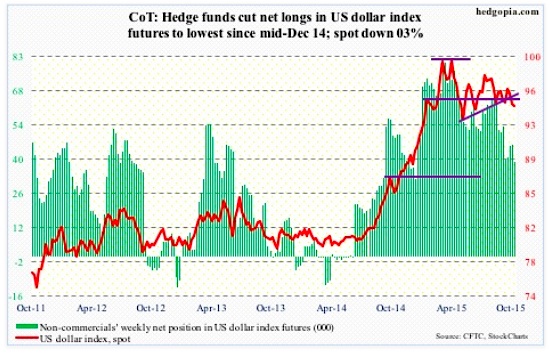
US Dollar Index: The game of blaming the US Dollar for weak results continues. Several companies did exactly that this week. Even the Beige Book took a note of it. A weak currency helps, but ultimately supply-demand dynamics need to be favorable.
In the U.S., end-demand is tepid, plus inventories are rising. The Federal Reserve is in a box. And a US Dollar Index that rallied 25 percent in nine months through March needs interest rates to move up, which is not happening. Per the October 13 COT Report, non-commercials continue to cut back on net longs of the US Dollar.
For the week, the US Dollar Index lost 0.3 percent, but closed substantially off the lows. It has lost both its 50- and 200-day moving averages, but has room to rally near-term.
October 13 COT Report data: Currently net long 38.9k, down 7.1k.
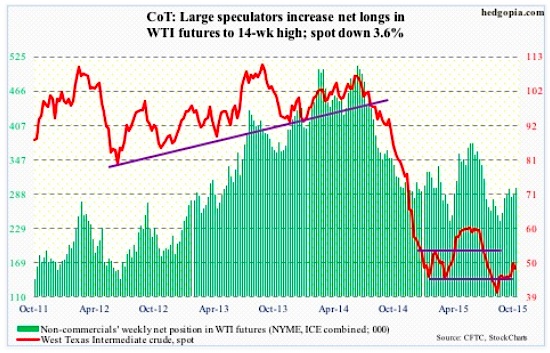
Crude Oil: Did Qatar’s oil minister jinx it? Last weekend, he declared oil prices have bottomed out, with signs of a recovery in 2016. He said growth in non-OPEC oil supply slowed substantially this year and is likely to turn flat or negative in the next, adding low prices have caused oil companies to reduce their capex by almost 20 percent this year from $650 billion in 2014.
Spot West Texas Intermediate crude oil started the week by dropping 4.1 percent on Monday, in the process losing mini support at $47-plus, and kept dropping the next couple of sessions. The 50-day moving average ($44.83), which is no longer dropping, drew buyers in on Thursday.
There was some good news on the production front. In the week ended October 9, oil production declined 76,000 barrels a day, to 9.1 million barrels a day, essentially offsetting the increase last week. Oil production peaked at 9.61 mb/d in the June 5th week. As well, gasoline stocks fell 2.6 million barrels, to 221.3 million barrels – a three-week low.
On the other hand, crude inventory shot up 7.6 million barrels, to 468.6 million barrels – the highest since the June 5th peak (470.6 million barrels). As well, refinery utilization dropped 1.5 percentage points to 86 percent. Utilization has dropped 10.1 percentage points over the past couple of months.
Technically, spot WTI crude oil prices have come under pressure since its rally attempt was repelled by its 200-day moving average last Friday, producing a shooting star. Bulls did defend the 50-DMA this week.
Non-commercials continue to add to net longs of Crude Oil.
October 13 COT Report data: Currently net long 297.9k, up 12k.
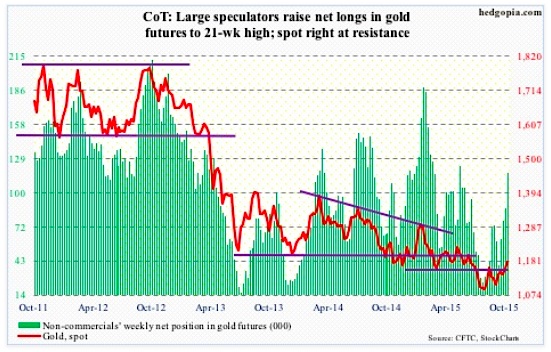
Gold: Gold prices crept higher on Monday and Tuesday, before shooting up another 1.7 percent on Wednesday reacting to lousy U.S. retail sales data for September and the weak PPI. Gold has been showing improved price action for a while now. From July 24th low to Thursday’s high, the SPDR Gold ETF (GLD) rallied 10 percent.
But the question is, can the momentum continue? Probably not near-term. Gold looks like it is in need of a rest. Daily technicals are grossly overbought, with both Thursday and Friday producing signs of distribution. The Wednesday action pushed the ETF above its 200-day moving average, but was not able to hold on to it. This is occurring right underneath resistance – both declining trend line and horizontal line.
With that said, as gold was rallying, it took care of resistance at $1,140, which can now provide support. Plus, the 50-day moving average ($1,132.33) is curling up. Medium to long-term, there is reason to be optimistic, just not near-term.
Non-commercials disagree, having raised net longs in Gold futures to a 21-week high (through October 13 COT report).
October 13 COT Report data: Currently net long 117.2k, up 30.3k.
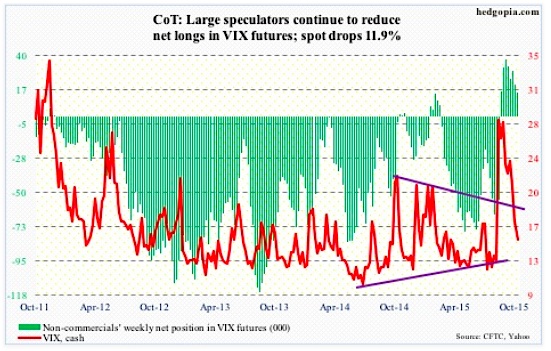
VIX Volatility Index: The spot VIX keeps deflating, now down 70 percent from the August 24th intra-day high of 53.29. In the meantime, the ratio of VIX to VXV, which measures three-month volatility on the S&P 500 (the VIX serves the same purpose but only goes out a month), has dropped to the low 0.80s from the August 24th intra-day high of 1.3. The ratio is at a level from where it has rallied in the past. For it to go lower still, the VIX needs to break support at 15.
October 13 COT Report data: Currently net long 15.6k, down 5.4k.
Thanks for reading.
Twitter: @hedgopia
Read more from Paban on his blog.
No position in any of the mentioned securities at the time of publication. Any opinions expressed herein are solely those of the author, and do not in any way represent the views or opinions of any other person or entity.


