The following is a recap of The COT Report (Commitment Of Traders) released by the CFTC (Commodity Futures Trading Commission) looking at futures positions of non-commercial holdings as of October 13, 2015. Note that the change is week-over-week.
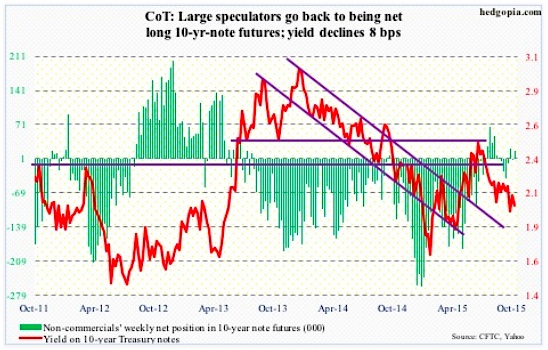
10-Year Treasury Note: Central bankers were probably busy scratching their heads this week. Despite trillions in quantitative easing and their valiant effort to push inflation above two percent, the latter keeps eluding them.
In September, consumer prices were unchanged in the U.S., after rising 0.2 percent in August. Core CPI rose 1.9 percent – ever closer to that elusive two-percent target. But the Federal Reserve prefers to focus on the core personal consumption expenditures price index, which only rose 1.3 percent in August; the last time it rose at two percent was back in April 2012. Producer prices are behaving much worse. Over the past year, they have fallen 1.1 percent.
Everywhere else we look, the story was the same in September. UK inflation (CPI) went negative, down 0.1 percent. China’s PPI fell 5.9 percent from a year ago. Japan’s PPI fell 3.9 percent from a year ago. And, wholesale prices in India fell 4.5 percent from a year ago.
It is worth noting that minutes of the September FOMC meeting seem to suggest that members are now focused more on inflation than on employment. Even in the latter, momentum is waning. Non-farm job openings in August dropped 298,000, to 5.37 million, while July was downwardly revised by 85,000.
Who can blame non-commercials for wanting to go net long 10-year note futures?
October 13 COT Report data: Currently net long 17.7k, up 20.2k.
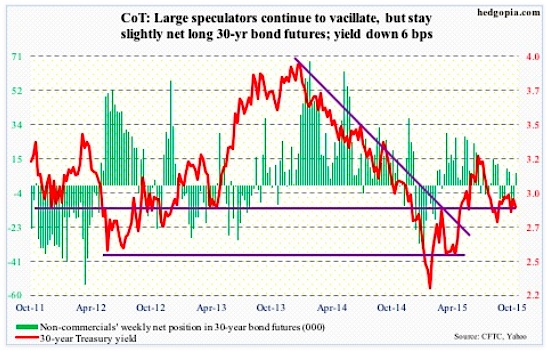
30-Year Treasury Bond: Economic data hasn’t provided the certainty that the Fed (or investors) need. This week is packed with housing-related data, so investors will likely be tuned in once again for clues.
The NAHB housing market index for October is published on Monday. The September reading of 62 was the highest since 68 in October 2005.
This will be followed by housing starts for September on Tuesday. Of late, builders have been putting their money where their mouth is. Starts dropped month-over-month in July and August, to a seasonally adjusted annual rate of 1.13 million units, but momentum has been building. On a 12-month rolling average basis, starts have come in north of a million units for nine straight months.
September’s existing home sales are due out on Thursday. They fell 4.8 percent month-over-month in August, but July’s 5.58 million units (SAAR) were the highest since 5.79 million in February 2007. On a 12-month rolling average basis, August was 5.17 million units – the highest since 5.21 million units in November 2007. Once again, momentum is building. The only potential negative is how rapidly price has risen. The median price in August was $228,700, with month-over-month decrease the past couple of months from June’s highest ever of $236,300. Even higher than the bubble peak of $230,400 in July 2006. Yes, the median price is past the bubble high, although sales are nowhere near.
Next week, just one Federal Open Mouth Market Committee (FOMC) member is scheduled to speak during weekdays. Jeffery Lacker, president of the Richmond Federal Reserve, will speak on Monday. He is a strong hawk, having dissented in the September meeting. By the way, as per the Beige Book, two of the 12 districts – Richmond and Chicago – reported that the pace of growth slowed from mid-August until early October. Will there be a change in Mr. Lacker’s tone?
October 13 COT Report data: Currently net long 6.7k, up 13.9k.
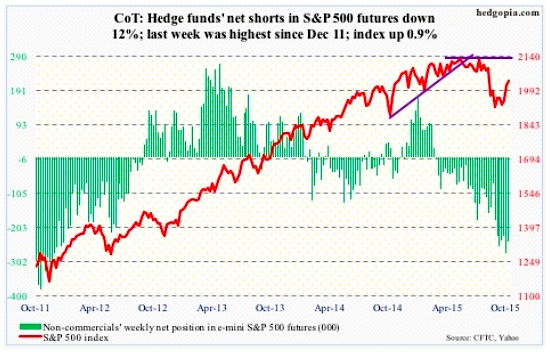
E-mini S&P 500: Something strange happened this week for a couple of key stocks. At least it was strange going by past standards. On Tuesday, Johnson & Johnson (JNJ), while reporting its September-quarter results, also announced a $10-billion buyback program, and the stock yawned. Then on Wednesday, Wal-Mart (WMT) forecast a 6-12 percent earnings drop in FY17, simultaneously authorizing a new $20-billion share repurchase program. Once again, investors focused on deteriorating fundamentals than on the allure of share buybacks.
Too soon to say if this is the beginning of a trend, but if it is, then it is coming at a wrong time. A common theme among companies reporting thus far has been continued pressure on the top line, although bottom-line estimates were met. Share buybacks, cost-cutting measures, etc. have helped the bottom line. Hopefully for the bulls, this is not a massive shift in sentiment toward stocks.
This is important as stock market flows are yet to perk up. Investors poured $2.5 billion into U.S.-based stock mutual funds and ETFs in the week ended Wednesday (courtesy of Lipper). Last week, there were $8 billion in outflows. The rally continues to struggle to excite buyers of stocks.
However, that is not the impression we get if we just focus on the improved price action.
The S&P 500 has managed to rally all the way up to just underneath broken support at 2040-2050. A convincing break here has the potential to squeeze the shorts big time. But for that to happen, stock market inflows will need to improve.
Non-commercials cut back net shorts a little, but are staying with massive holdings.
October 13 COT Report data: Currently net short 244.4k, down 33.8k.
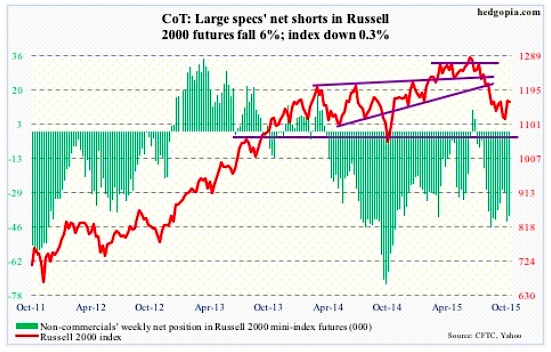
Russell 2000 mini-Index: Last week, the Russell 2000 rallied 4.6 percent for the week, raising hopes that risk-on was back on the table. As well, high-yield bond funds attracted $1.5 billion during the week ended this Wednesday (courtesy of Lipper).
Not so fast. This week, the Russell 2000 was a laggard, down 0.3 percent versus up 0.9 percent for the S&P 500, up 1.2 percent for the Nasdaq composite, and up 0.8 percent for the Dow Industrials. Not a particularly great sign for small cap stocks and demand for “beta” (i.e. risk) near-term.
Turns out the options market read it well. As of Friday last week, in the October 16th expiration the amount of put open interest on IWM, the iShares Russell 2000 ETF, heavily outweighed call open interest.
October 13 COT Report data: Currently net short 40.5k, down 2.6k.
continue reading on the next page…


 and Semiconductors (SMH): Concerning Price Pattern?")
 and Semiconductors (SMH): Concerning Price Pattern?")


