The following is a recap of the recent Commitment of Traders Report (COT) released by the CFTC (Commodity Futures Trading Commission) looking at Commitment of Traders data and commodity futures positions of non-commercial holdings as of May 9.
Note that the change in COT report data is week-over-week. Excerpts of this blog post also appear on Paban’s blog.
3 Commitment of Traders (COT) report charts kooking at spec futures positions in key commodities like Gold and Crude Oil, along with the US Dollar.
CRUDE OIL: Currently net long 379.8k, down 27.5k.
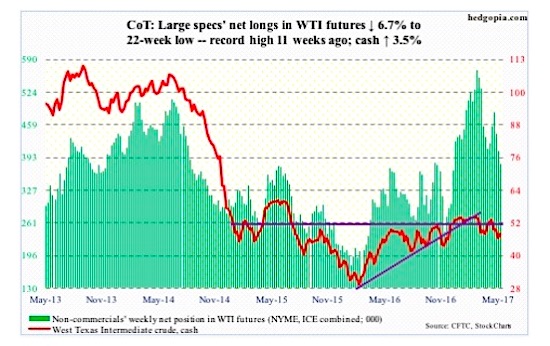
Wednesday’s EIA report was just what oil bulls needed. Spot West Texas Intermediate crude oil ($47.84/barrel) in that session rallied 3.2 percent to $47.33 – just past near-term resistance at $47.
Recall that last Friday the crude oil reversed higher after dropping to $43.76 intraday to test support at $42-$43.
Both 50- and 200-day moving averages lie above, with the latter offering resistance at $49.20. This is followed by the 50-day at $49.65.
The EIA report showed that crude oil stocks for the week ended May 5 were down 5.2 million barrels to 522.5 million barrels. This was the fifth straight week-over-week drop since reaching a record 535.5 million barrels five weeks ago.
Gasoline and distillate stocks dropped, too – down 150,000 barrels to 241.1 million barrels and down 1.6 million barrels to 148.8 million barrels, respectively.
As well, crude oil imports fell 644,000 barrels per day to 7.6 million b/d – an eight-week low.
Crude oil production, on the other hand, rose 21,000 b/d to 9.3 mb/d. Since OPEC reached a cutback agreement late November last year, U.S. crude production has increased by 615,000 b/d.
Refinery utilization fell 1.8 percentage points w/w to 91.5.
GOLD: Currently net long 150k, down 39.6k.
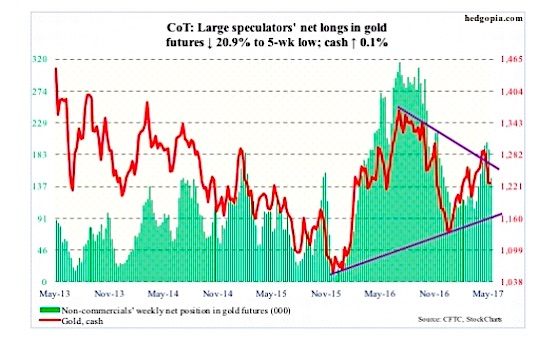
The cash ($1,227.7) is generating no investor interest at the moment.
In nine sessions through Wednesday, the SPDR Gold ETF (NYSEARCA:GLD) saw activity only once – that of redemptions of $46.8 million on Monday (courtesy of ETF.com).
This is reflected in how the metal is trading – essentially flat this week.
Action near term likely gets decided by if daily or weekly conditions prevail, with the former oversold and the latter still overbought. If daily wins, gold bugs face resistance at 50- and 200-day moving averages ($1,246.74 and $1,252.56, respectively).
US DOLLAR INDEX: Currently net long 35.7k, down 4.3k.
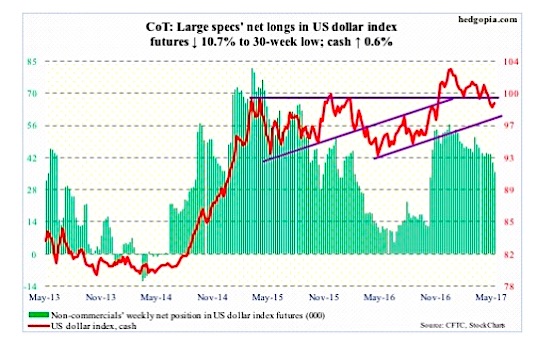
The US Dollar Index (CURRENCY:USD) managed to retake the 200-day moving average.
That said, three weeks ago, the dollar index lost a rising trend line from last May, the underside of which provided resistance Thursday. If this is won over, there is resistance around 100.5, which represents a declining trend line from early this year.
Non-commercials continue to shy away, having cut net longs to a 30-week low.
Thanks for reading.
Twitter: @hedgopia
Author may hold a position in mentioned securities at the time of publication. Any opinions expressed herein are solely those of the author, and do not in any way represent the views or opinions of any other person or entity.
: Creating Bullish Divergence?")


 and Semiconductors (SMH): Concerning Price Pattern?")


