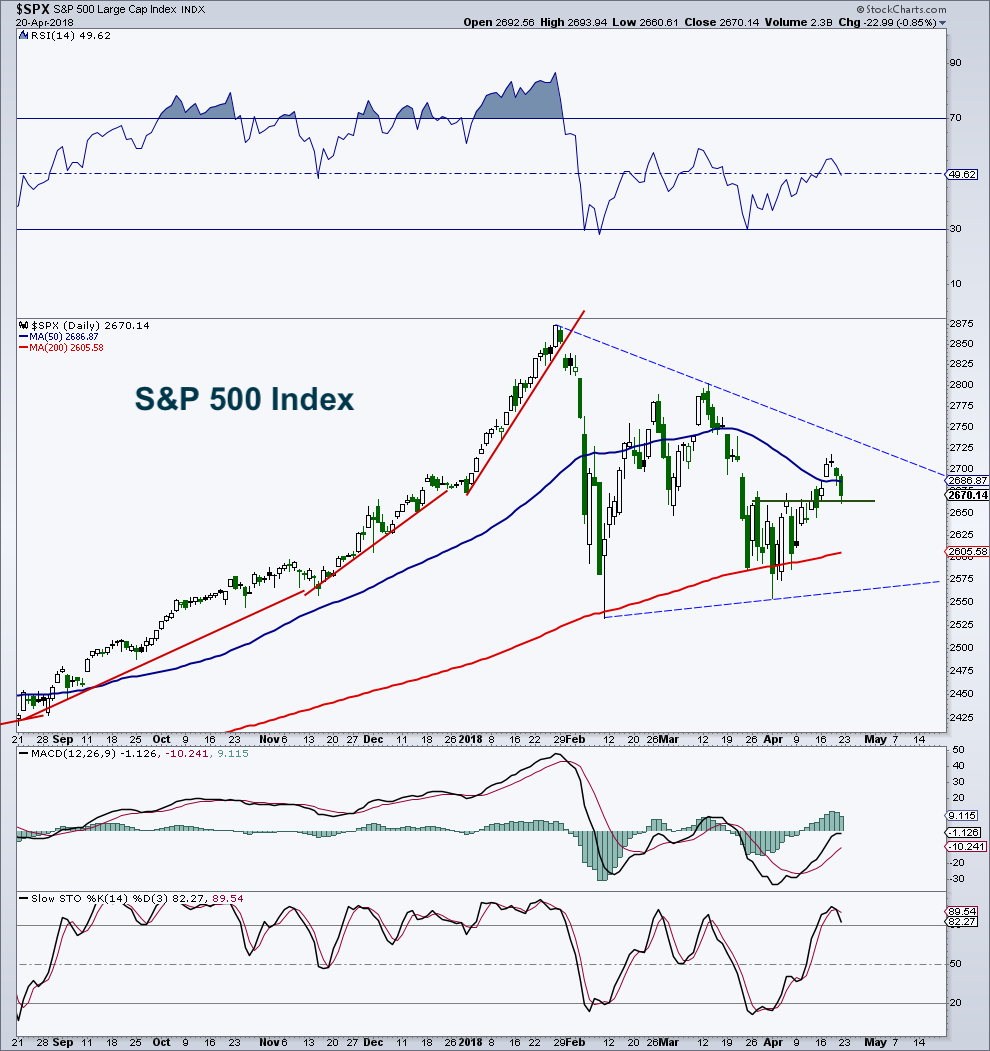
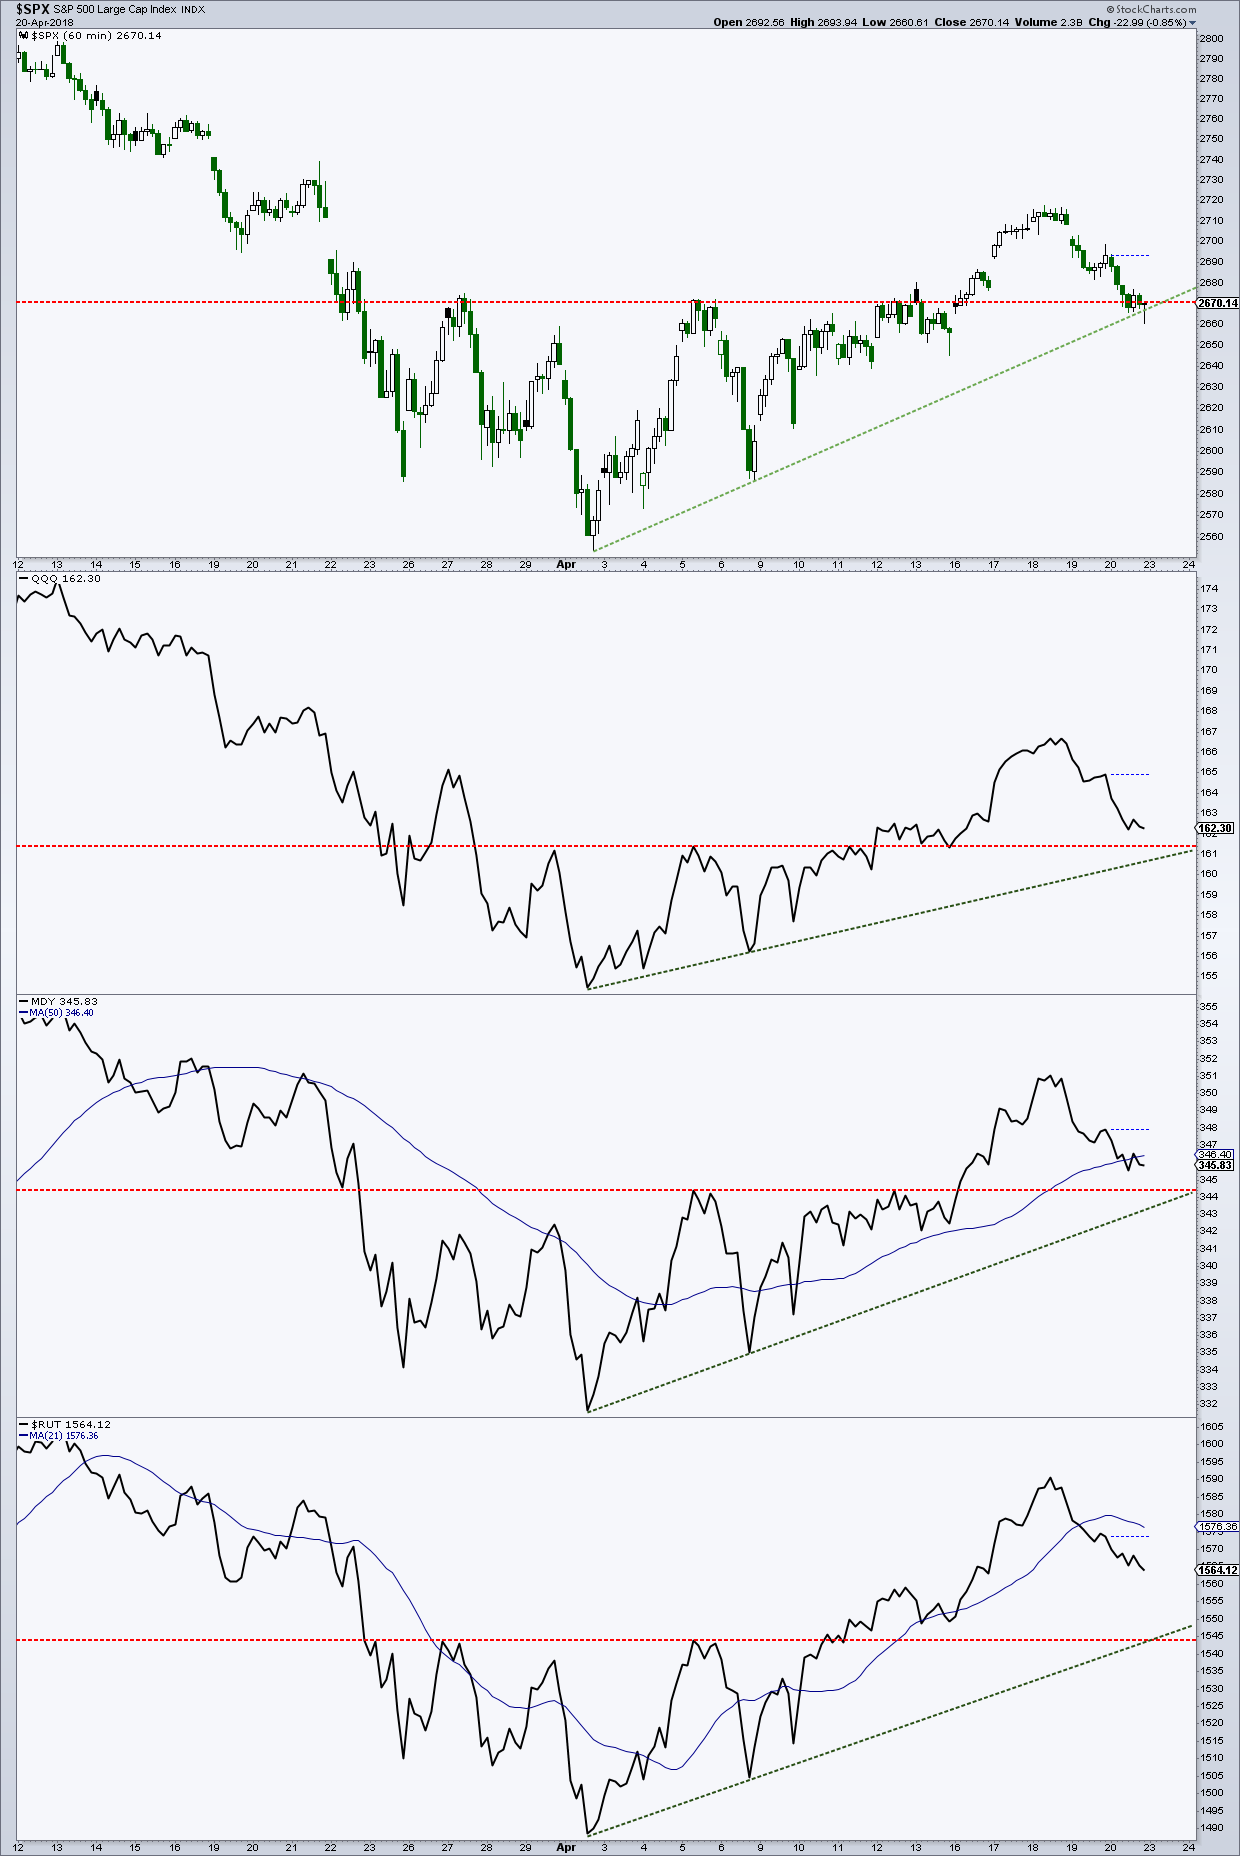
The major stock market indices all broke out of complex inverse head-and-shoulders formations early this week. And based on the size of these bullish patterns, they could have additional upside in the near term.
Yet I’m still bothered by the non-traditional and trajectory lacking potential double bottom.
Whether this comes back and haunts the stock market before a forecasted run to new highs is difficult to say.
One of the things that does not get talked about or addressed enough with respect to technical analysis and basic charting is the price slope. I generally talk about slopes when they become too steep (January) on the upside (parabolic, asymptotic) as well as too steep on the downside (panic, capitulation).
How else can we use slope or the rise over the run as they taught us in high school math?
A side note: the great thing about many, many professions is that there is always something new right around the corner, and you just have to look or think outside the box. Something I can never remember looking at (that doesn’t mean I haven’t in the past, as I am getting older) is comparing price slopes off of bottoms. While I complained that the second bottom hesitated, and did not appear like many other quick and dirty double bottoms, I never compared today’s slope to prior double bottoms.
Well just as I suspected, the slope off the April 2 closing low to yesterday’s closing low just doesn’t match the double bottoms I have talked about. I compared the slope of the twelve-day run to the slopes of the double bottoms on the S&P 500 in 2016, 2015, 2011, 2007, 1998, and the double bottom of the NASDAQ Composite in 2008/2009 and it did not match the steepness of any of the prior bottoms.
Something else that is missing from the current bottom attempt, (and remember, it’s not officially a double bottom until the interim high (2,802) is taken out), is a “breadth thrust” in the first couple of weeks of the rebound. There are a couple of ways to measure or look for this thrust. The easiest piece of evidence is at least one 90% up day, or a day that shows 90% of the total trading volume went into rising stocks. We did reach 87% on April 10, so we got close. Historically, rallies that contain 90% days in the first couple of weeks were stronger than those that did not contain such lopsided strength.
Feel free to reach out to me at arbetermark@gmail.com for inquiries about my newsletter “On The Mark”. Thanks for reading.
Twitter: @MarkArbeter
The author may have a position in mentioned securities at the time of publication. Any opinions expressed herein are solely those of the author, and do not in any way represent the views or opinions of any other person or entity.


