Futures Trading Outlook & Considerations For August 17, 2017
The S&P 500 (INDEXSP:.INX) continues to trade range bound but any break up/down will likely see some continuation. Below are key trading levels to follow with added color from our premium service. The charts below and added “trading setups” are being shared exclusively with See It Market readers.
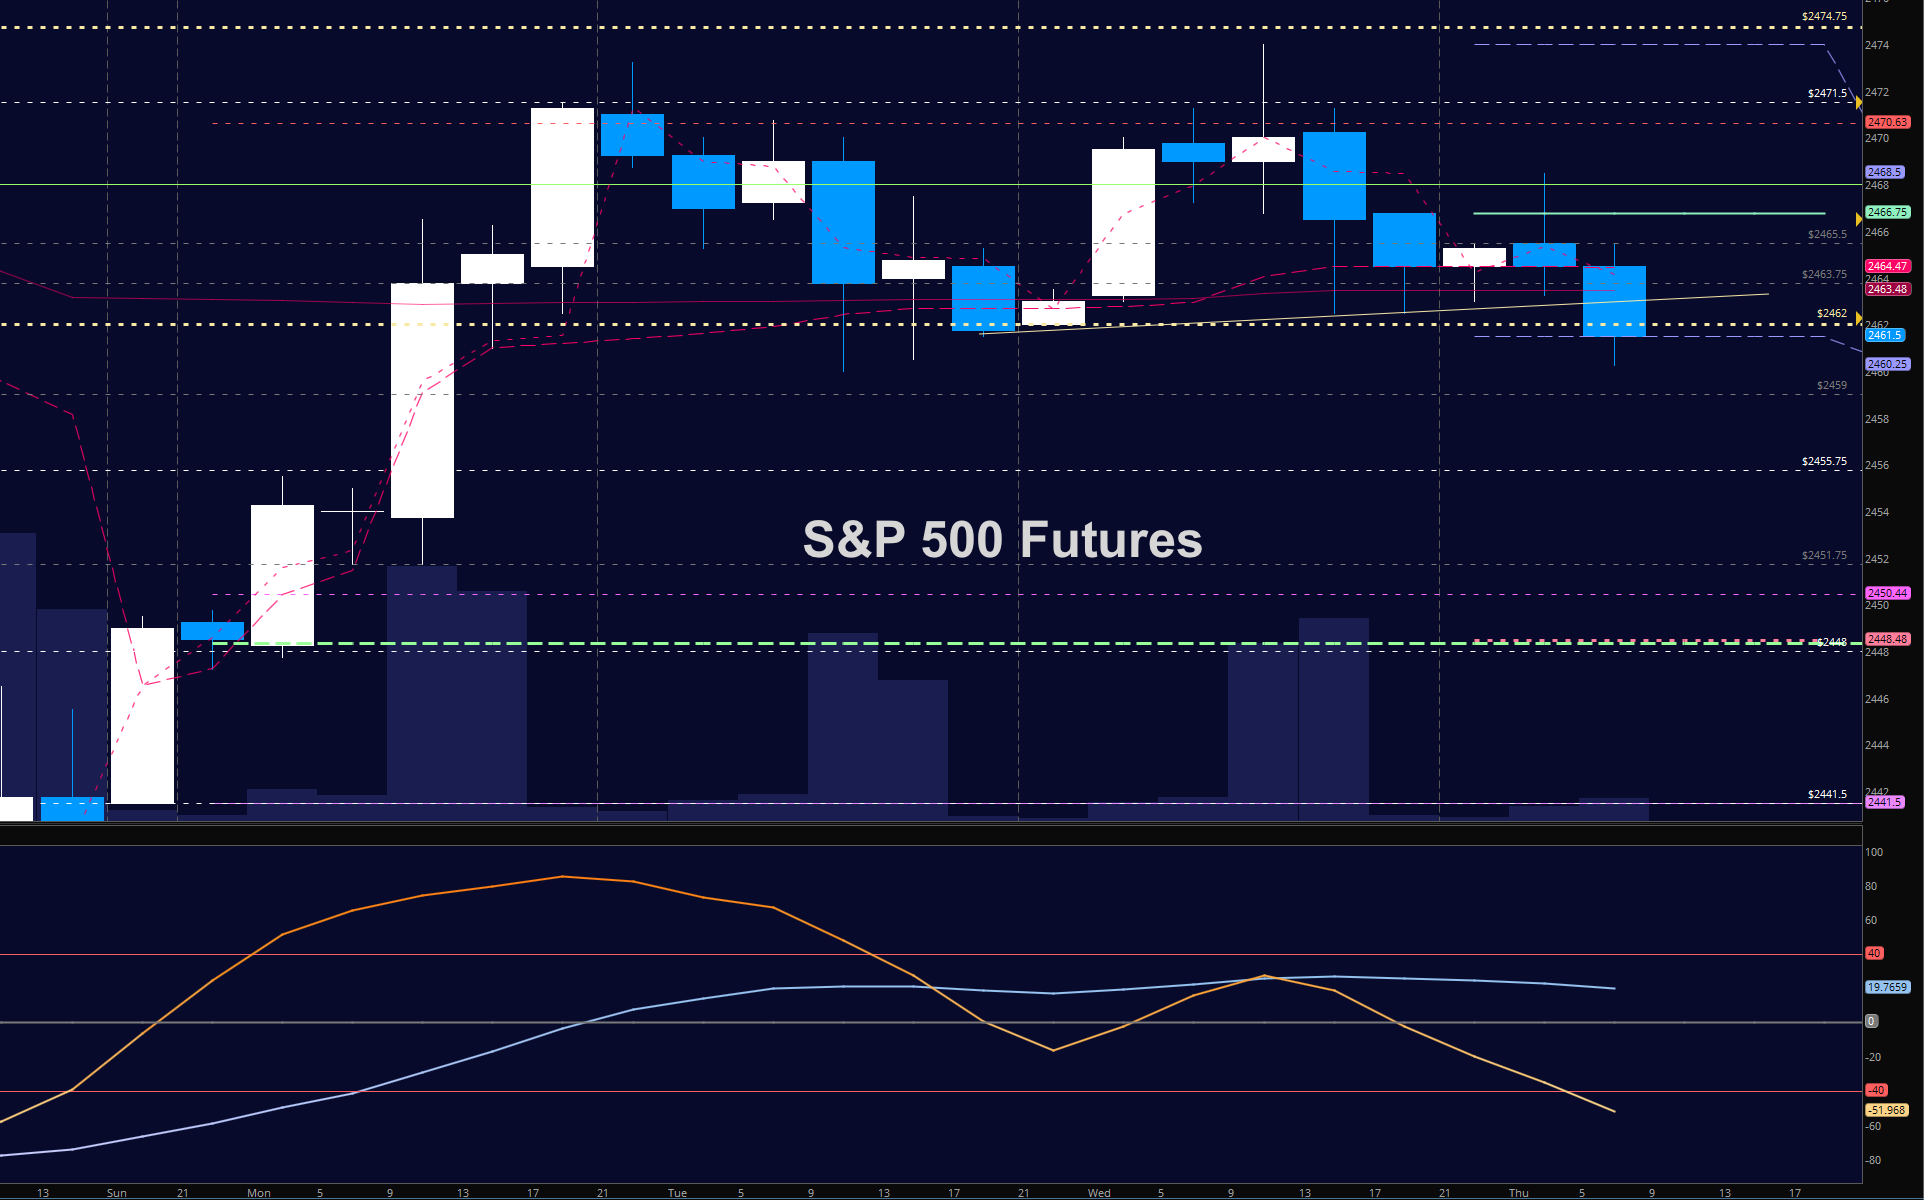
S&P 500 FUTURES (ES)
Charts test lower support in the early morning. Bounces will find resistance and a failure to hold support will send us to lower support again. The bullets below represent the likely shift of trading momentum at the positive or failed retests at the levels noted.
- Buying pressure intraday will likely strengthen above a positive retest of 2471.5
- Selling pressure intraday will likely strengthen with a failed retest of 2459.25
- Resistance sits near 2471.5 to 2474, with 2478 and 2482.5 above that.
- Support holds between 2461.5 and 2455.75, with 2451.5 and 2445.5 below that.
Trading Setups
Upside trades:
- Positive retest of continuation level -2468.75
- Positive retest of support level– 2466.75
- Opening targets ranges- 2467.5, 2468.5, 2470.5, 2472.5, 2474.5, 2477.75, 2479.5, 2480.5, 2483.5
Downside trades:
- Failed retest of resistance level -2463.5
- Failed retest of support level– 2459.75
- Opening target ranges–2461.5, 2459.5, 2455.75, 2453.75, 2451.25, 2449.25, 2446.25, 2442, 2440.25, 2438.5, 2436.75, 2433.25, 2431.75, 2429.5, 2427, 2426.75, 2425.5, 2422.75, 2420.75, 2419, 2415.75
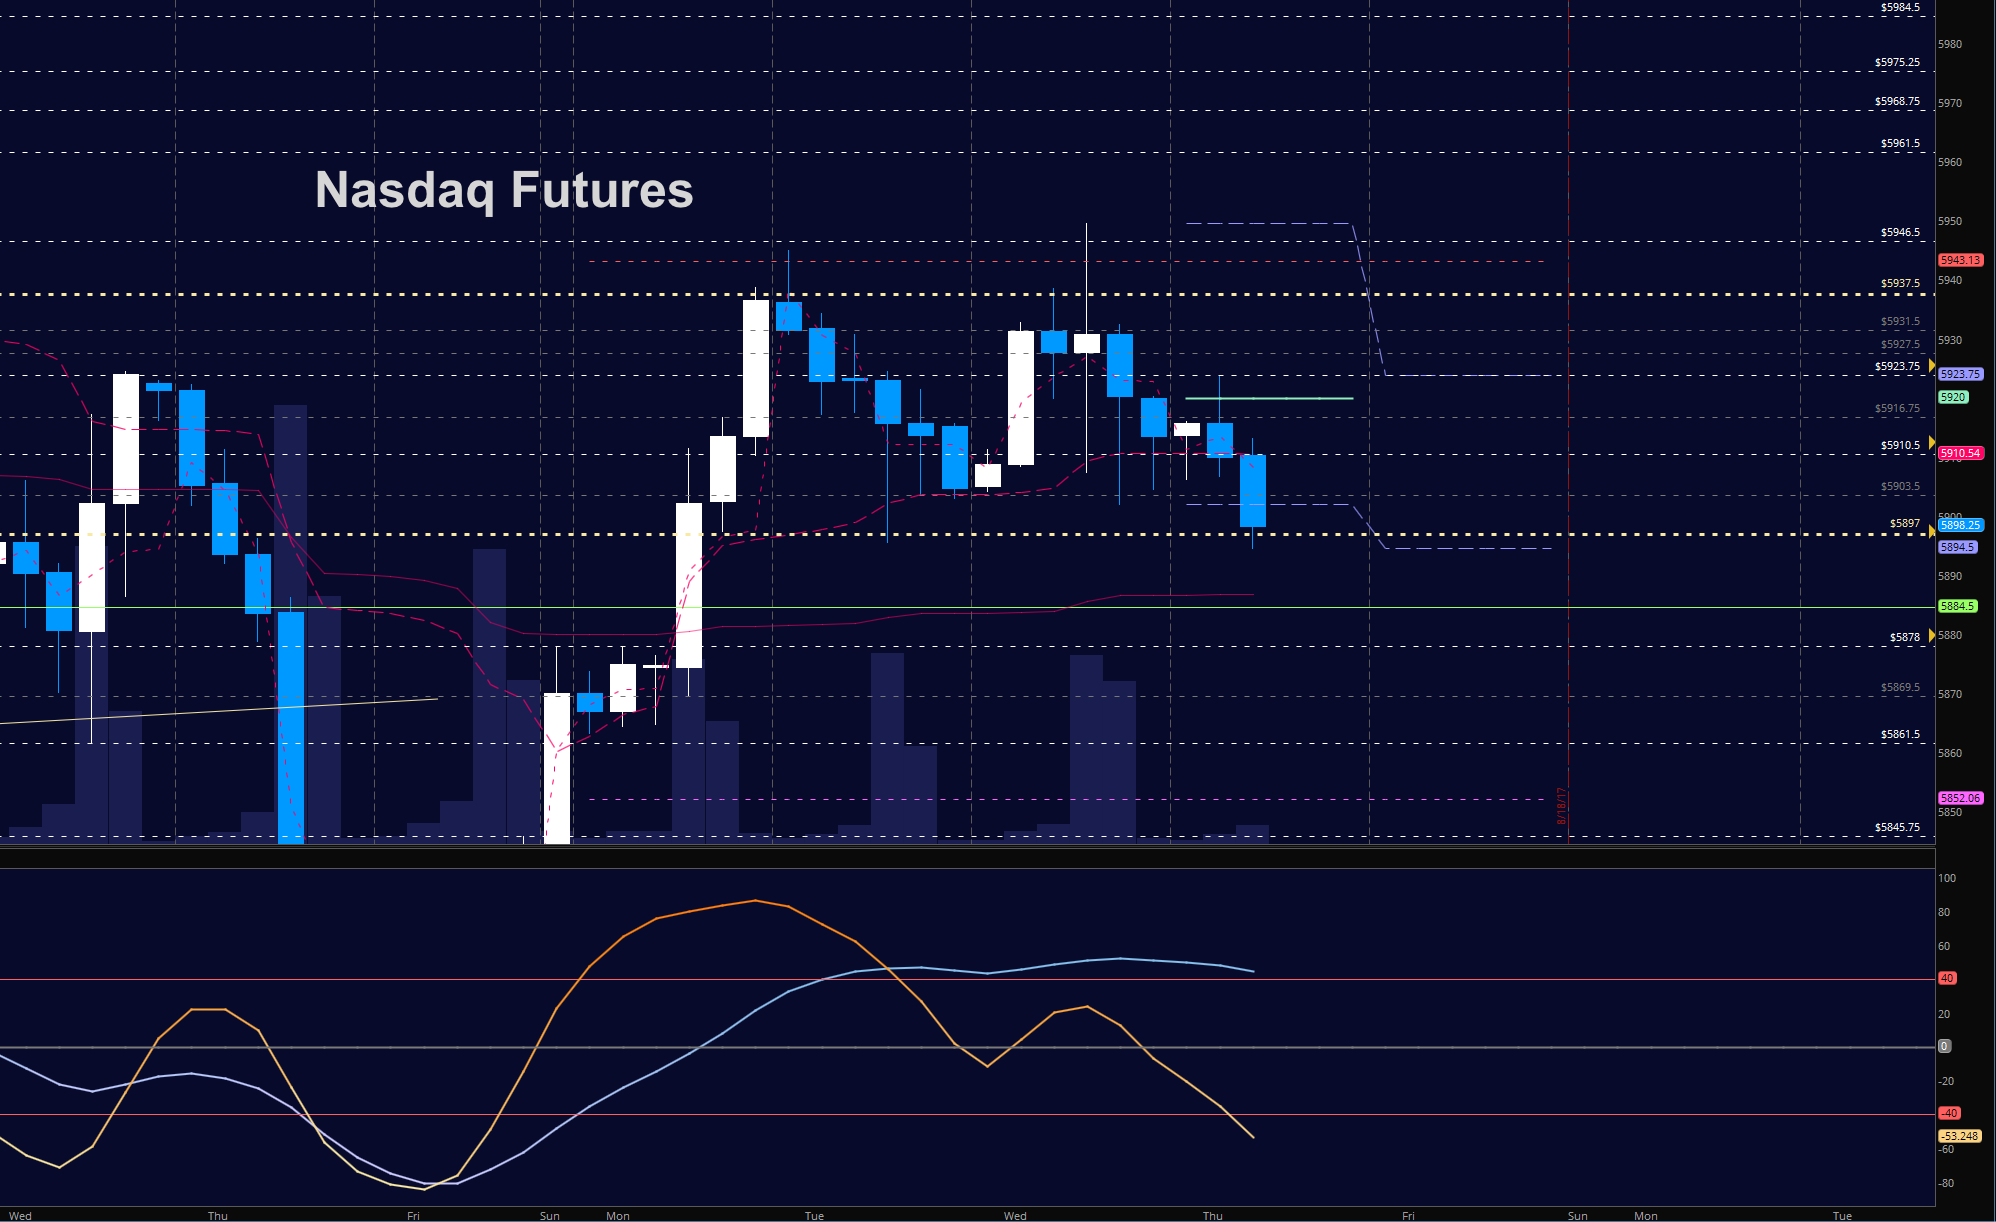
NASDAQ FUTURES (NQ)
Nasdaq (INDEXNASDAQ:.IXIC) price supports are failing but buyers will attempt to hold the lows. Failed tests of resistance will send us back to 5884. Momentum is still mixed. The bullets below represent the likely shift of intraday trading momentum at the positive or failed tests at the levels noted.
- Buying pressure intraday will likely strengthen with a positive retest of 5916.75
- Selling pressure intraday will likely strengthen with a failed retest of 5894
- Resistance sits near 5920.5 to 5926.75, with 5931.5 and 5947.5 above that.
- Support holds between 5894.25 and 5886.5, with 5882.75 and 5870.75 below that.
Trading Setups
Upside trades
- Positive retest of continuation level -5916.75
- Positive retest of support level– 5903.75
- Opening target ranges –5908.5, 5615.5, 5920.5, 5923.5, 5925.75, 5930.5, 5933.75, 5936.75, 5941.5, 5945.75, 5951.5, 5954.5, 5957.25, 5961.25, 5975, 5980.75
Downside trades
- Failed retest of resistance level -5910.25
- Failed retest of support level– 5894.5
- Opening target ranges – 5918, 5916.75, 5906.75, 5903.75, 5900.25, 5895.5, 5892.25, 5887, 5884.5, 5880.25, 5878, 5869.5, 5861.5, 5855.75, 5852.75, 5837.75, 5831.5, 5825, 5819.5, 5810.75, 5796.75, 5786.5, 5776.75, 5772.5, 5763.5, 5761, 5751.75, 5723.25, 5714.5, 5698.25, 5690.75
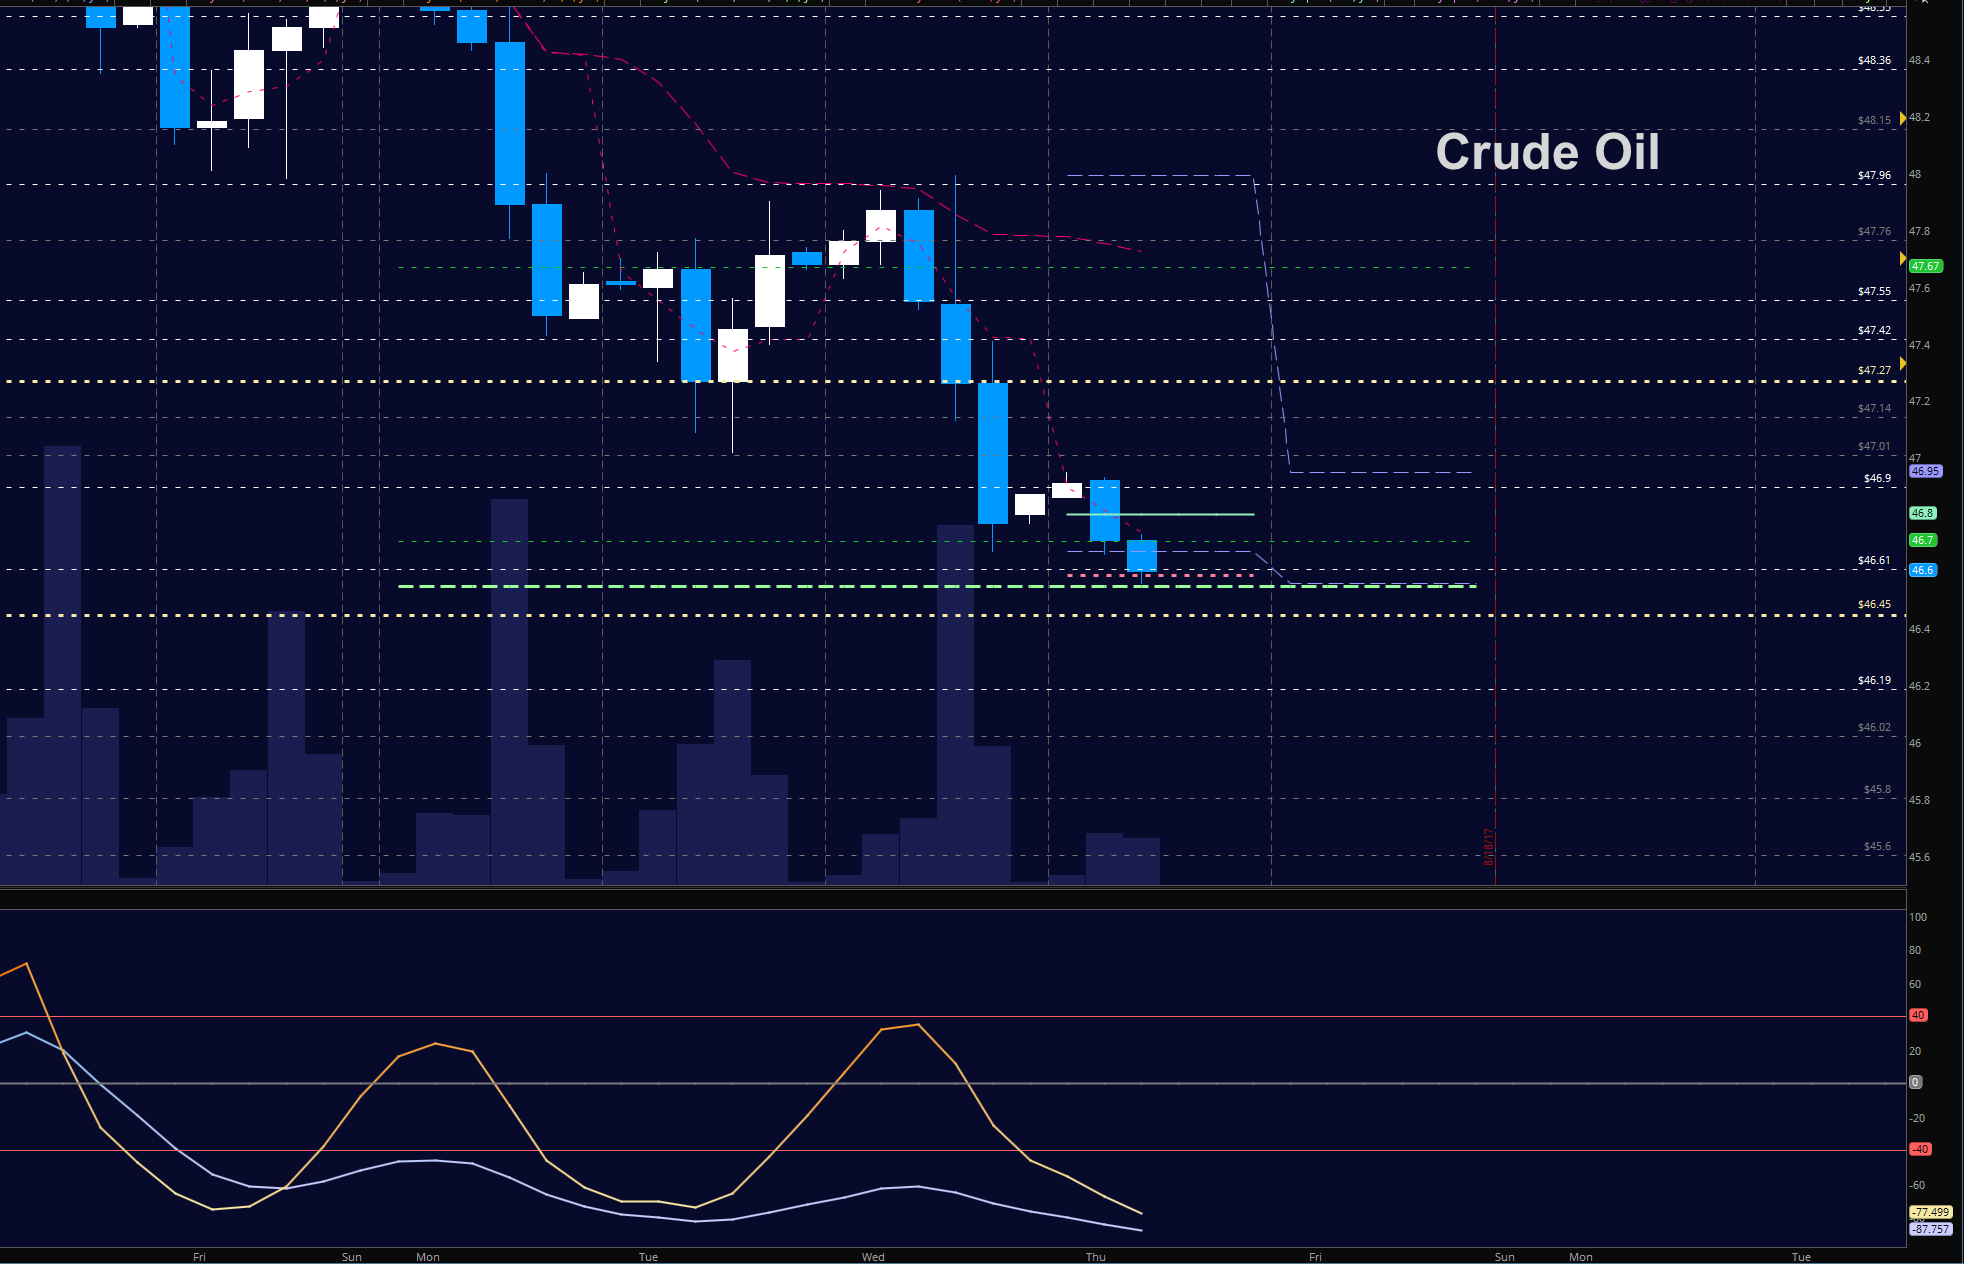
WTI CRUDE OIL
Deep support is holding near composite moving averages at 46.5. Bounces into resistance will still meet sellers. Resistance extends into 47.29. Momentum is mixed. The bullets below represent the likely shift of trading momentum at the positive or failed tests at the levels noted.
- Buying pressure intraday will likely strengthen with a positive retest of 47.27
- Selling pressure intraday will strengthen with a failed retest of 46.5
- Resistance sits near 47.26 to 47.55, with 47.74 and 48.12 above that.
- Support holds between 46.5 to 46.19, with 46.03 and 45.46 below that.
Trading Setups
Upside trades
- Positive retest of continuation level -47.9
- Positive retest of support level– 47.46
- Opening target ranges – 47.6, 47.77, 47.85, 48.01, 48.15, 48.32, 48.55, 48.67, 48.8, 49.08, 49.16, 49.34, 49.53, 49.72, 49.82, 49.95, 50.06, 50.21, 50.34, 50.62, 50.82, 51.13
Downside trades
- Failed retest of resistance level -47.62
- Failed retest of support level– 47.4
- Opening target ranges– 47.4, 47.22, 47.09, 46.94, 46.72, 46.61, 46.45, 46.22, 45.98, 45.79, 45.42, 45.14, 44.92, 44.52
If you’re interested in watching these trades go live, join us in the live trading room from 9am to 11:30am each trading day. Visit TheTradingBook for more information.
If you’re interested in the live trading room, it is now primarily stock market futures content, though we do track heavily traded stocks and their likely daily trajectories as well – we begin at 9am with a morning report and likely chart movements along with trade setups for the day.
As long as the trader keeps himself aware of support and resistance levels, risk can be very adequately managed to play in either direction as bottom picking remains a behavior pattern that is developing with value buyers and speculative traders.
Twitter: @AnneMarieTrades
The author trades stock market futures every day and may have a position in mentioned securities at the time of publication. Any opinions expressed herein are solely those of the author, and do not in any way represent the views or opinions of any other person or entity.


 Rolling Over At Key Fibonacci Level?")

