The Morning Report: Stock Market Futures Test Support, Head Higher
Sellers are taking advantage of a bounce into resistance overnight to take charts back into familiar support levels. Failed resistance tests still seem likely ahead if we bounce to test 1864 and hold- but that will also mean higher highs relative to the days nearby. Longer time frame resistance levels for S&P 500 futures are sitting now at 1884.25, 1890.75, and 1906. Charts clearly showed the divergent action in momentum suggesting this bounce from yesterday was a possibility – note yesterday’s post and the comment, “ Charts are setting up another relief bounce ahead” – positive divergence sent the clues here.
Intraday resistance for S&P 500 futures sits near 1876.25. Intraday support sits at 1837.25 -(congestion sits at 1847.5 and 1864– watch these midlines – it will gives clues to moves ahead). Bounces should still be sold near resistance – just watch for higher lows to form. We have bearish momentum formations that are lifting on some time frames- overall the environment for stock market futures is negative, but mixed as folks attempt to pick a bottom. (Not even close to a bottom, but again, it’s the relief bounce thing)
Shorter time frame momentum indicators are negative but lifting, and higher than Wednesday. Longer cycles are downward trending and lifting, but firmly in negative territory- this means strong resistance tests can be sold.
See today’s economic calendar with a rundown of releases.
THE RANGE OF TUESDAY’S MOTION
Crude Oil Futures (CL_F)
Crude Oil is attempting to create a new support zone near 28. All bounces have been failing and broad momentum suggests this will remain the scenario for now.
Trading ranges are between 27.8 and 29.7, with 28.55 being an important support level to recapture. So far, charts are unable to breach midline congestion. EIA reports today – API suggested a bigger than expected build.
Moving averages in oil are still clearly negative on longer time frames and are now approaching range expansion events that make bounces more appealing as trades into resistance. Momentum for crude oil market futures is securely negative. I remain quite bearish from a fundamental and technical space. Bounces will be into resistance.
Intraday long trade setup suggests a long off 28.55 retest (counter trend big picture) into 29.07, 29.34, 29.7, 29.94, 30.02, 30.32, 30.56, 30.78, and 31.01– see the blog for levels above that region.
Intraday short trade setup suggests a short below a 28.36 failed retest or a rejection of the 29.3 area sends us to 29.01, 28.85, 28.54, 28.35, 28.08, 27.88, and 27.6 to 27.43. 26.46 and 25.26 looms ahead as next levels down in a bigger time frame expansion. Momentum on longer time frames remains sloping negative.
E-mini S&P 500 Futures (ES_F)
Below is a S&P 500 futures chart with price support and resistance trading levels for today. Click to enlarge.
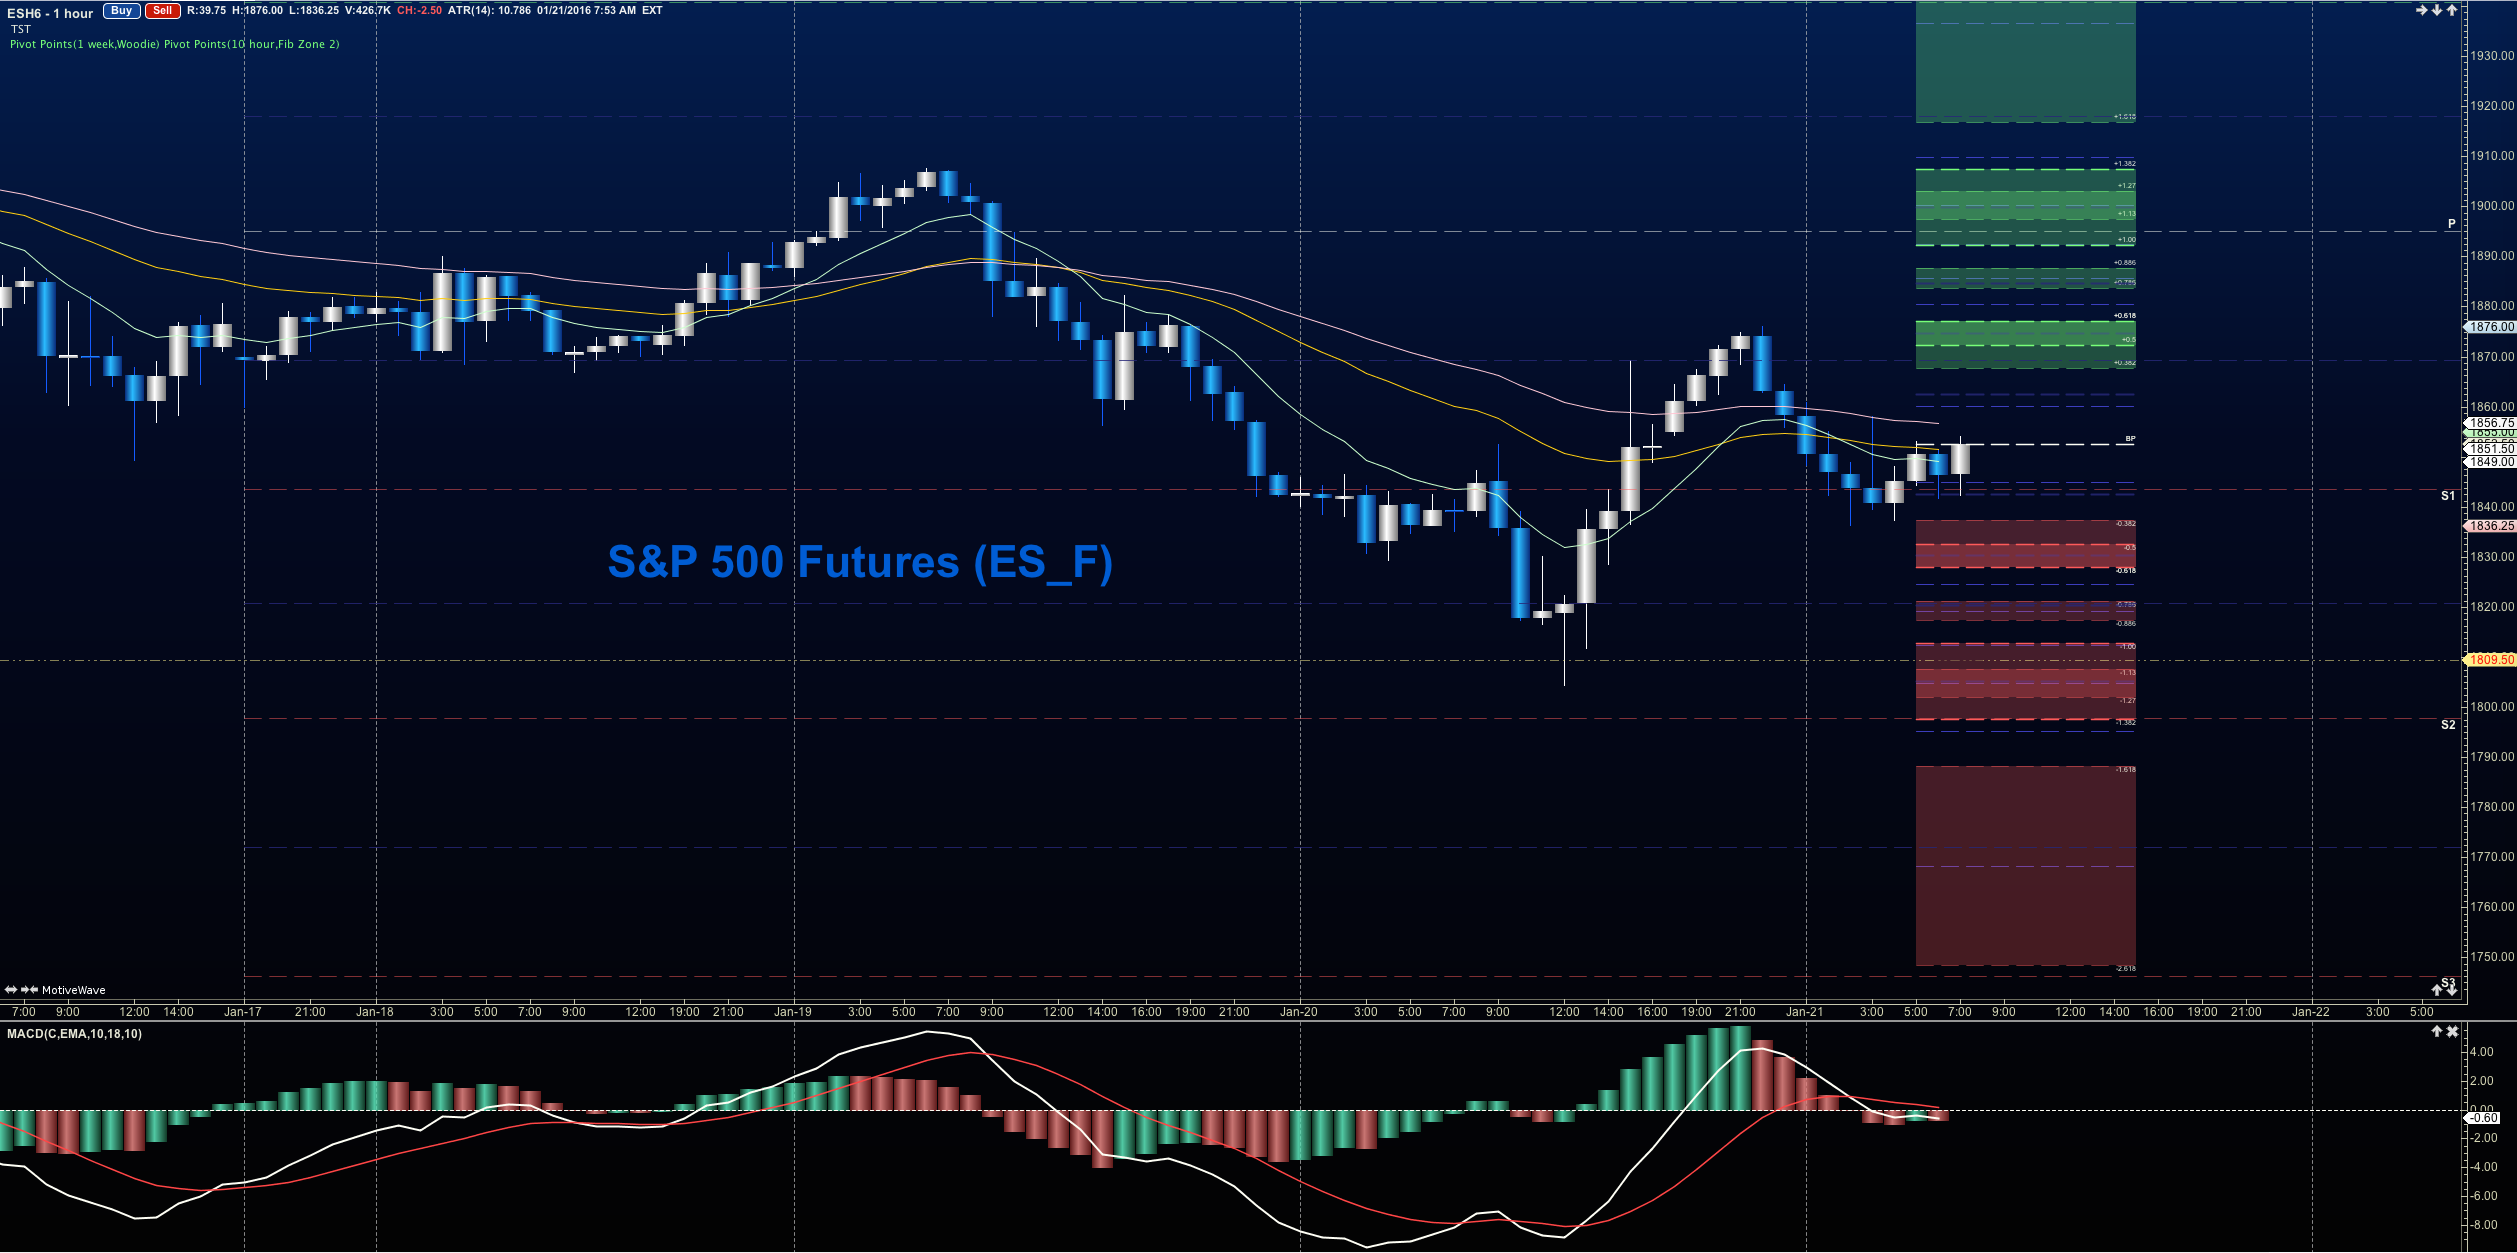
Chart holding steady above lower level support- currently testing 1843 – much like yesterday. Primary support sits at 1821.25, but a new band of buyers is attempting to hold 1838- bigger bearish formations still give the chart seller strength- but we are at a potential inflection region short term.
Upside motion for S&P 500 futures has the best setup on the breach of and positive retest of 1861.5 – or a bounce off 1838.5 (as long as momentum shows this as likely to hold- watch momentum or the drift lower is possible)- Targets from 1840.5 are 1843.75, 1852, 1863.5, 1868.25, 1872.5, 1883.25, 1889.25, and 1902.25. Big resistance test is still at the region between 1874-1878 if the charts hold a bounce – that’s exactly where sellers showed up in early trading today -so watch that area again for sellers to try to reverse the trend of the bounce, if the chart continues north over 1864.25. The chart could expand under positive strength into 1884, so be careful to watch. Long trades are still counter trend into resistance intraday at this writing.
Downside motion opens below the failed retest of 1836.5 or at the failure to hold 1875.5 bounce. Retracement into lower levels from 1875.5 gives us the targets at 1868.5, 1861.25, 1857.75, 1845.5, 1842.5, 1837.5, 1834.5, 1831.25, 1829.25, 1825.5, 1820.75, 1812.5, and perhaps 1800.75 if the chart really loses its footing. We are attempting to base again at the 1838 level.
Short action intraday is with the bigger trend (we are bouncing into resistance) currently unless we have a breach and positive retest of 1902.25 and positive momentum patterns.
If you’re interested in the live trading room, it is now primarily stock market futures content, though we do track heavily traded stocks and their likely daily trajectories as well – we begin at 9am with a morning report and likely chart movements along with trade setups for the day.
As long as traders keep themselves aware of support and resistance levels, risk can be very adequately managed to play in either direction as bottom picking remains a behavior pattern that is developing with value buyers and speculative traders.
Twitter: @AnneMarieTrades
The author trades stock market futures every day and may have a position in mentioned securities at the time of publication. Any opinions expressed herein are solely those of the author, and do not in any way represent the views or opinions of any other person or entity.


")
 Ready To Break Out?")