Earnings season continues and the futures markets don’t seem to care. Beyond a promising pre-market here or there, S&P 500 futures buyers hold little hope against the fall in the charts.
The Morning Report: 1829.25 Support; 1864.25 Resistance
S&P 500 futures buyers are trapped and are selling each bounce. Sellers are taking advantage of momentum and trend and continue to ride price action down to deeper support. Failed resistance tests still seem likely ahead if we bounce to test 1864 and hold. Deeper support levels range from 1724 to 1598. The S&P 500 futures charts are setting up for another relief bounce ahead.
Intraday resistance for S&P 500 futures sits near 1864.25. Intraday support sits at 1829.25 -(congestion sits at 1843.5 – watch this midline – it will gives clues to moves ahead). Breaks of either resistance or support must be retested on tighter time frames (30min/1hr) for trending trades on the day to hold. Bounces should still be sold near resistance. We have bearish momentum formations that are holding steady on longer time frames.
Shorter time frame momentum indicators are negative to flat, and lower than Tuesday. Longer cycles are downward trending and lifting somewhat, but firmly in negative territory.
See today’s economic calendar with a rundown of releases.
THE RANGE OF TUESDAY’S MOTION
Crude Oil Futures (CL_F)
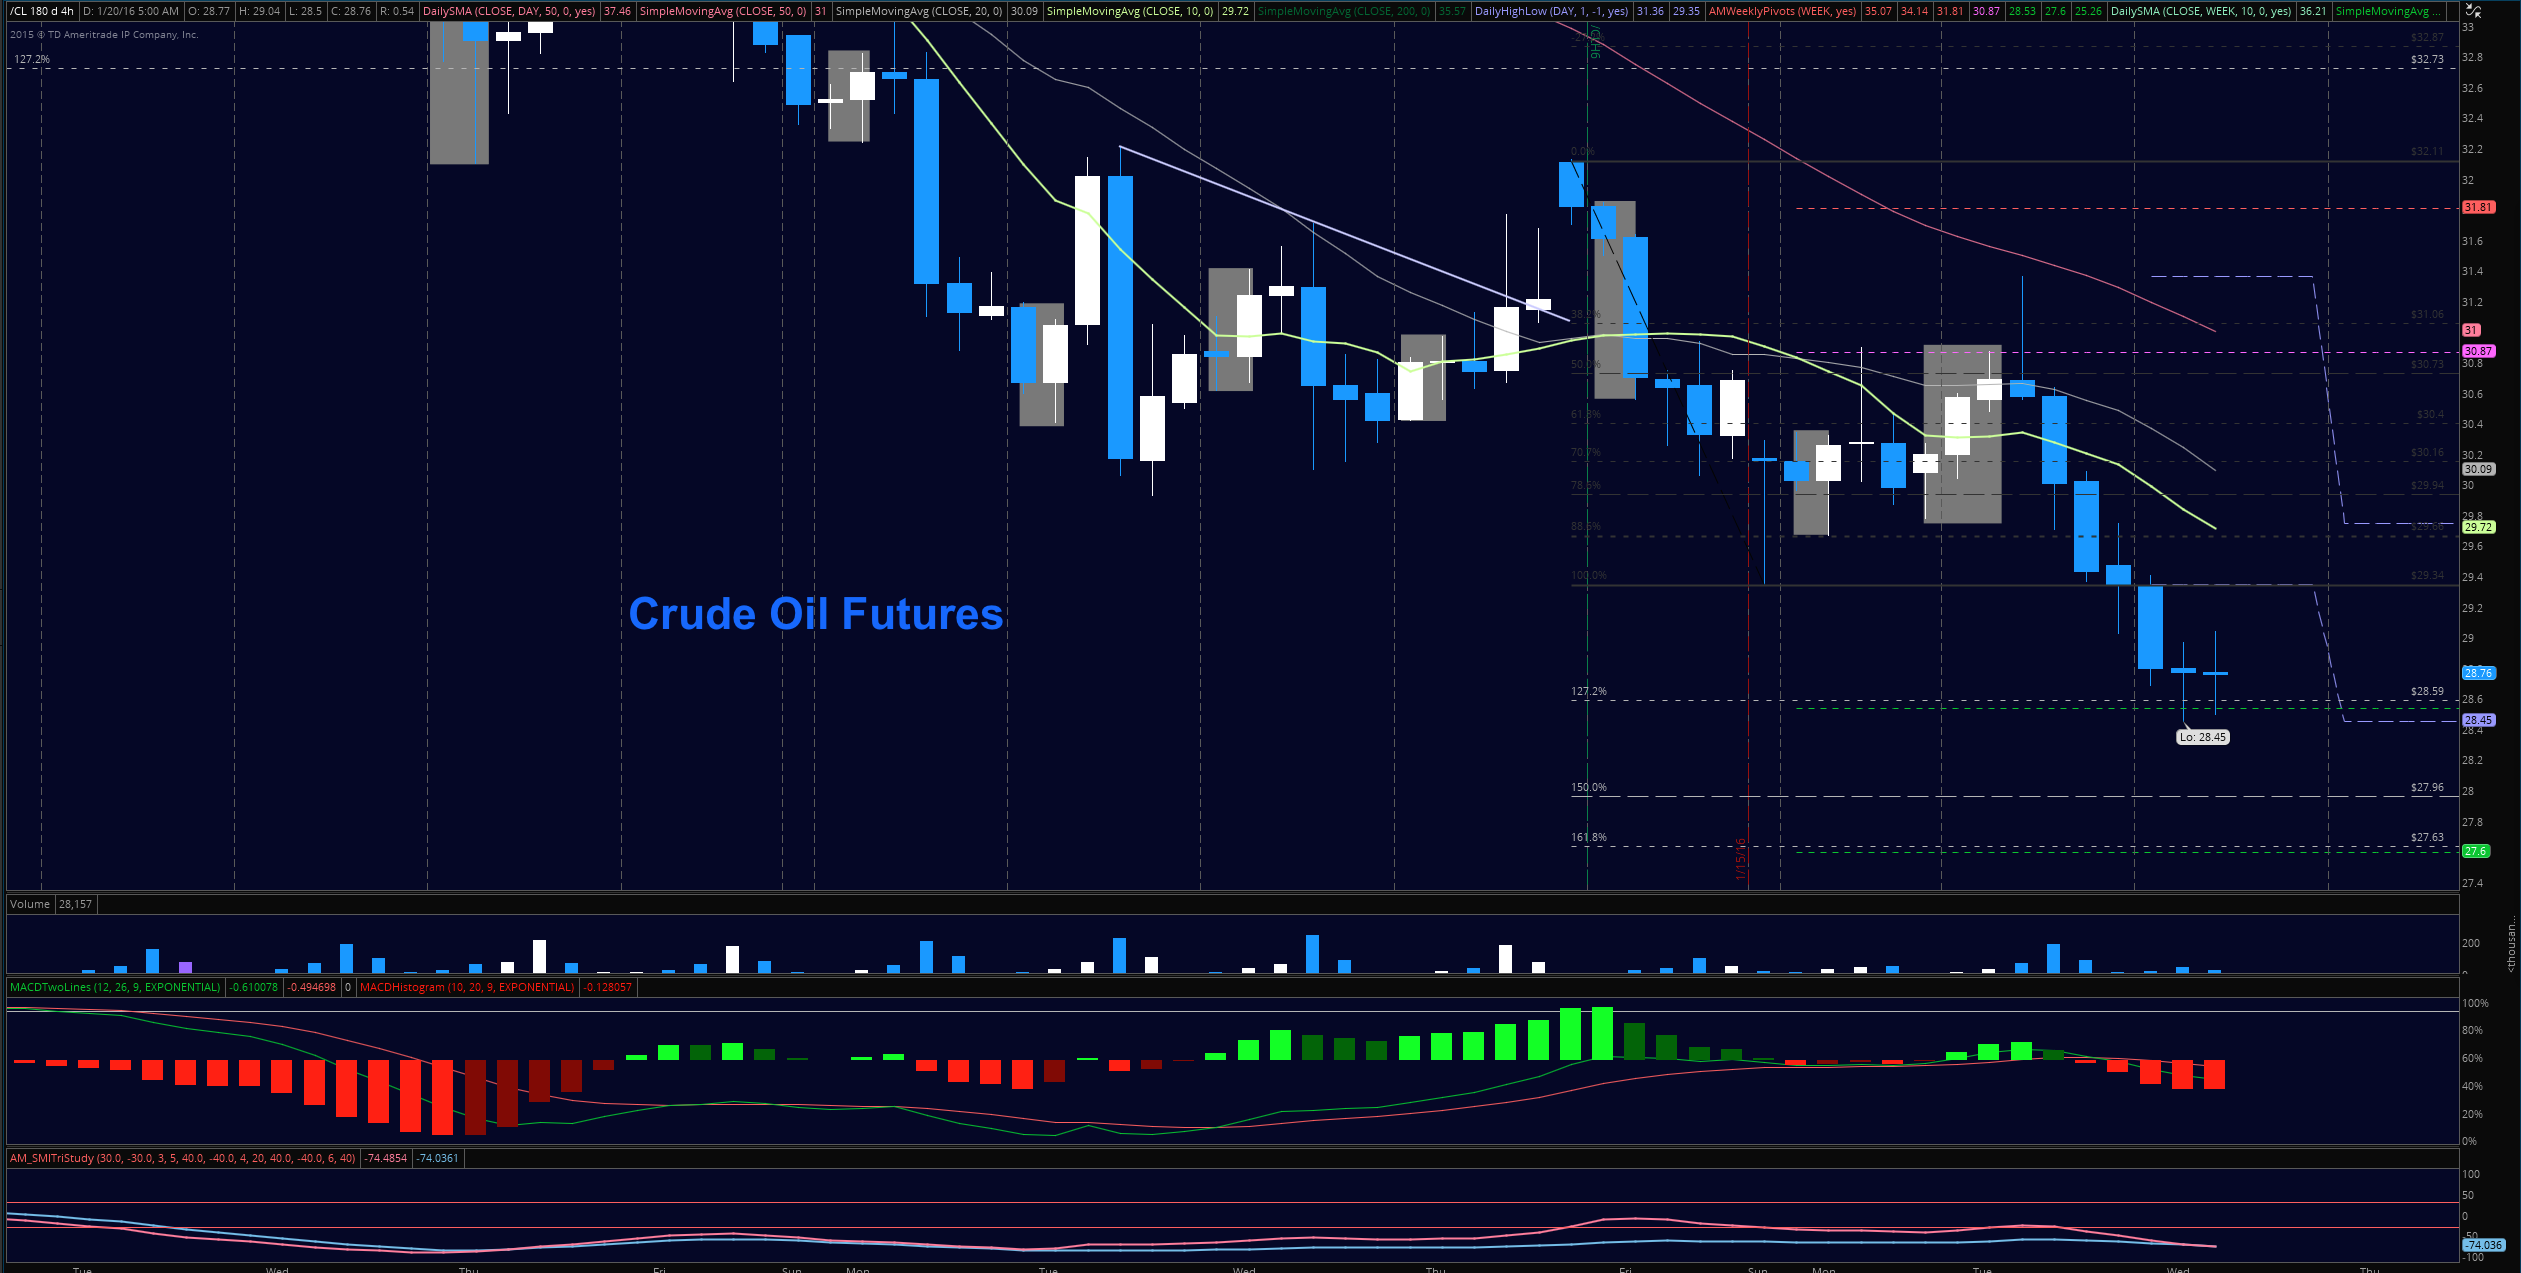
Crude oil futures prices are attempting to create a support zone near 28.6. I still suspect a relief bounce on the backs of hopeful traders that will fail – current resistance around 29.4.
Trading ranges are between 28.45 and 29.4, with 28.78 being an important support level to hold. So far, charts are unable to breach midline congestion.
Moving averages for crude oil futures are still clearly negative on longer time frames and are now approaching range expansion events that make bounces more appealing as trades into resistance. Momentum is securely negative but continues to look divergent particularly on the 4 hour chart. If this chart is bottoming, we could chop around this region for a while. And even head lower in the space. I remain quite bearish from a fundamental and technical space. Bounces will be into resistance.
Intraday long trade setup suggests a long off 28.78 retest (counter trend big picture) into 29.07, 29.4, 29.7, 29.94, 30.02, 30.32, 30.56, 30.78, and 31.01– see the blog for levels above that region.
Intraday short trade setup suggests a short below a 28.6 failed retest or a rejection of the 29.7 area sends us to 28.78, 28.58, 28.35, 27.96, and 27.6 to 27.43. Momentum on longer time frames is negative.
E-mini S&P 500 Futures (ES_F)
Below is a S&P 500 futures chart with price support and resistance trading levels for today. Click to enlarge.

The chart of the S&P 500 futures is holding steady above lower level support- currently testing 1840. S&P 500 futures primary support sits at 1829.25- bearish formations still give the chart seller strength. Upside motion has the best setup on the breach of and positive retest of 1856.5 – or a bounce off 1840.5 (as long as momentum shows this as likely to hold)- Targets from 1840.5 are 1843.75, 1852, 1863.5, 1868.25, 1872.5, 1883.25, 1889.25, and 1902.25. Big resistance test now at the region between 1874-1878 if the charts hold a bounce, so watch that area for sellers to try to reverse the trend of the bounce, if the chart continues north over 1864.25. Long trades are counter trend into resistance intraday at the time of this writing.
Downside motion opens below the failed retest of 1853.25 or at the failure to hold 1863.75 bounce. Retracement into lower levels from 1853.25 gives us the targets at 1846.75, 1840.5, 1837.5, 1834.5, 1831.25, 1829.25, 1825.5, 1820.75, 1812.5, and perhaps 1800.75 once more. We are attempting to base at the 1838 level.
Short action intraday is with the bigger trend lower in the futures market (we are currently bouncing into resistance). This state remains unless we have a breach and positive retest of 1914.75, along with positive momentum patterns.
As long as traders stay aware of support and resistance levels, risk can be very adequately managed to play in either direction as bottom picking remains a behavior pattern that is developing with value buyers and speculative traders.
Twitter: @AnneMarieTrades
The author trades stock market futures every day and may have a position in mentioned securities at the time of publication. Any opinions expressed herein are solely those of the author, and do not in any way represent the views or opinions of any other person or entity.


: Showing Some Signs of Emerging Strength")
