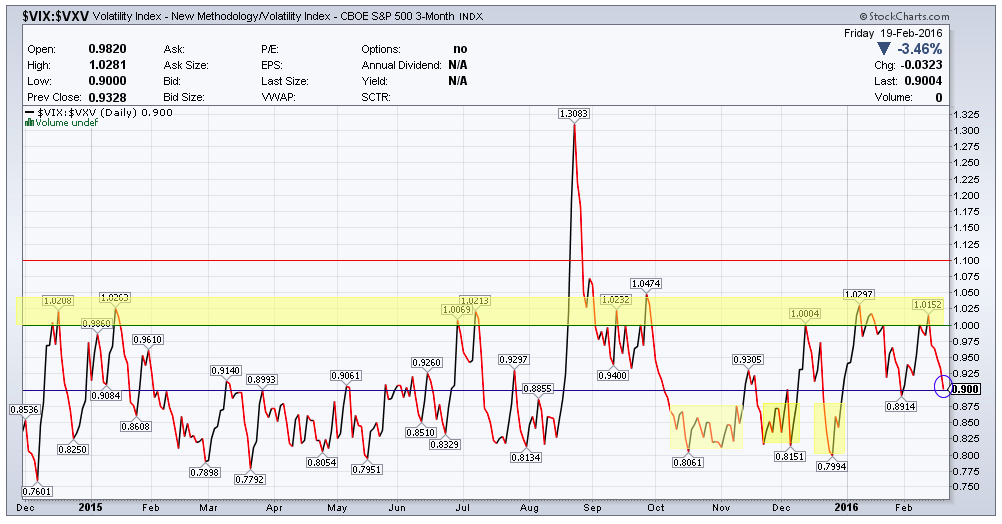
Volatility Term Structure – $VIX:$VXV Ratio:
VXV is the 3 month volatility index. The relationship between VXV and VIX (30 day volatility) or the ratio between them if > 1.00 often spells trouble for equities. This ratio continues to ease off to the downside. It finished at 0.900, so next move may be important.
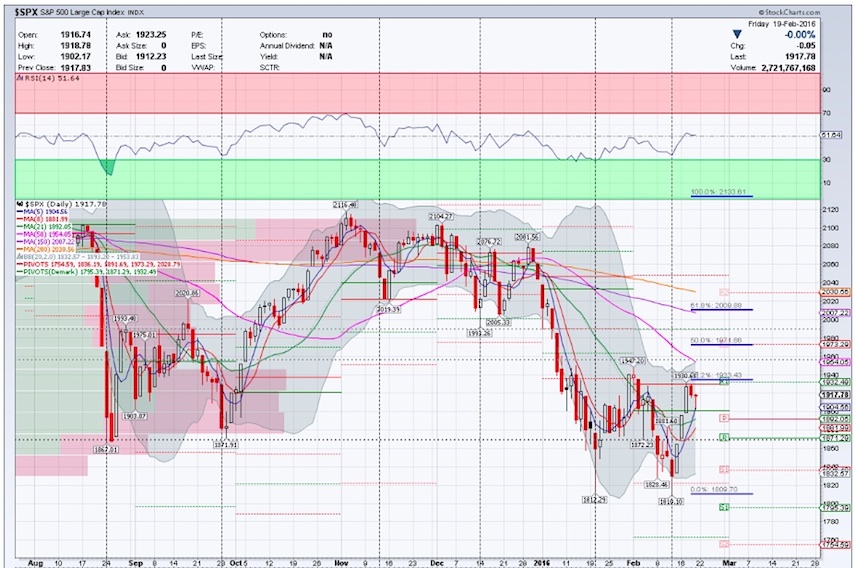
S&P 500 ETF ($SPY) – Daily Chart:
$SPY ended the week with a strong week with a lower close. This is potentially another lower high for the Higher low that $SPY printed the prior week.
From a momentum indicator standpoint, RSI is flat after rising over the median. It is still not in the bullish zone but constructive enough so far. The MACD that crossed up is now rising but it is well below median. Nothing positive there despite the cross. Slow STO is almost overbought (taking less than a week). Bollinger Bands though are opening up on this timeframe. This could be a great opportunity for some back and forth filling or consolidation.
Thanks for reading.
Twitter: @sssvenky
The author has a position in S&P 500 related securities. Any opinions expressed herein are solely those of the author, and do not in any way represent the views or opinions of any other person or entity.


