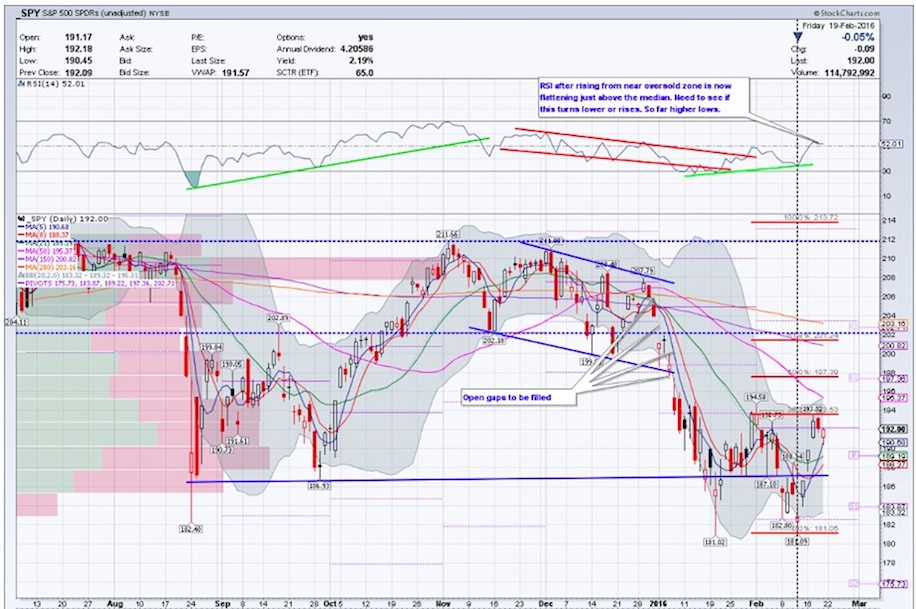
Last week we got the anticipated bounce in a stock market downtrend. We are giving back some of those gains to start the week, but the key question is: What will happen next?
From what I see, I expect range-bound consolidation this week between 1884-1933 with big support at 1872 on the S&P 500 Index (SPX). Of course, there is a chance of going higher towards 1940-1950, however I will curb my expectations beyond that at least as of now.
Most sectors, from a very short term perspective came into the week overbought or nearing overbought levels. So some back and filling is expected.
We had a huge move from 1810 to 1933 or so. Crude Oil is trying to hold on to the gains from last week but struggling and looking lethargic. Watch for signs of decoupling from the stock market indices to cue an overall change in the character of the market (no signs yet).
Gold has held support near 1190 and bounced but best scenario might be some consolidation with a chance of higher prices. Bonds are something investors should be watching out for as safe heaven trades are catching a bid. That said, we will take it one step at a time. And as of now, the longer term picture for stocks is still pointing down. Not a whole lot has changed from that perspective despite some constructive action – the potential for the downside resumption cannot be ruled out.
Here’s the updated chart of $SPX.
Economic reports this week:
- S&P Cash-Shiller, Consumer Confidence, Existing Home Sales, Richmond Fed Manufacturing Index came out on Tuesday
- PMI Services Flash, New Home Sales, EIA Petroleum Status Report on Wednesday
- Durable Goods Orders, Jobless Claims on Thursday
- GDP, Personal Income Outlays, Consumer Sentiment on Friday
Additionally there are quite a few Federal Reserve representatives talking during the course of the week.
BREADTH INDICATORS:
From a Bread Indicator standpoint, here are a few charts/indicators to keep an eye on.
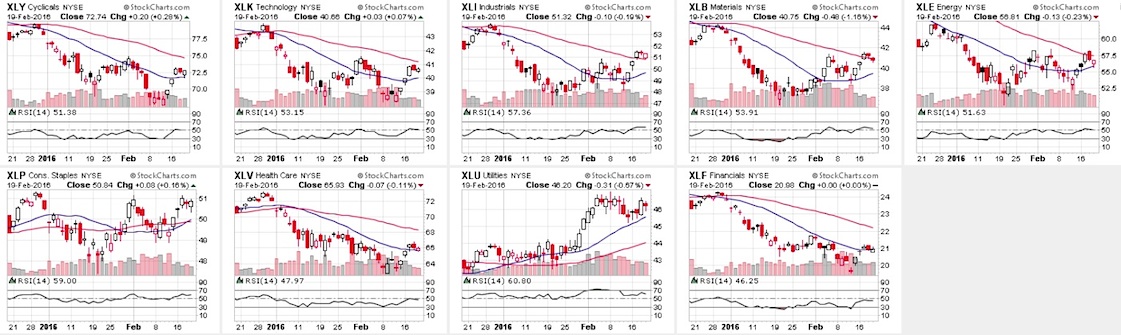
SECTOR PERFORMANCE: CANDLESTICK GLANCE:
From sector performance standpoint, most of the sectors have their RSI over median but only just bit. I would certainly not call that bullish but just constructive. None of them are either overbought or oversold. $XLU and $XLP are still the top performing stock market sectors overall.
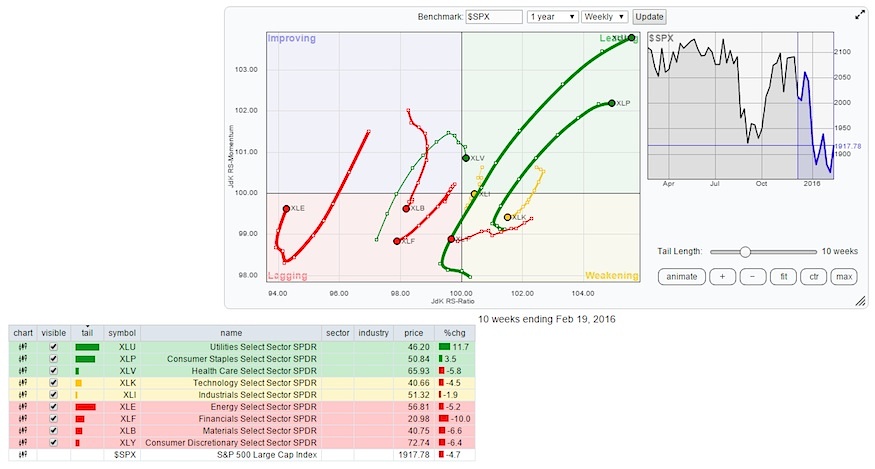
The Relative Rotation Graph (RRG) chart showing the leaders and the laggards among the 9 sectors.
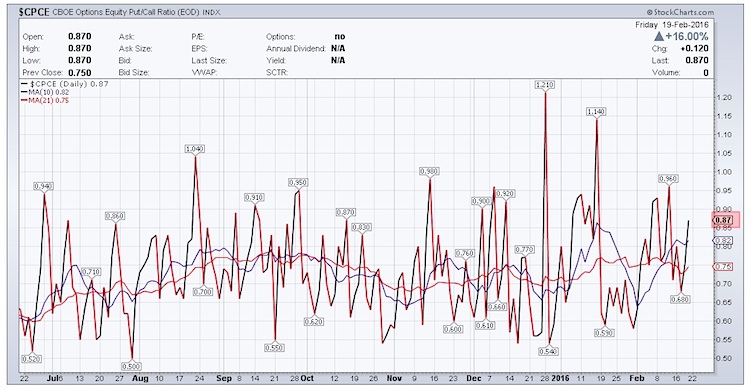
$CPCE – CBOE Options Equity Put/Call Ratio:
The CBOE Options Equity Only Put/Call Ratio saw another spike to 0.87 last week. Some fear setting in may be near the clear resistance zones but still a lot of complacency on both sides of the stock market. Of course, the Volatility Index (VIX) shows no fear yet although still elevated at over 20. With some consolidation next week, see if this spikes a bit more.
NAIIM Exposure Index Reading – 41.05:
The NAAIM Exposure Index represents the average exposure to US stocks and stock market indices.
While the NAIIM Exposure Index reading has moved to 41.05, no real edge here. Still pays to be careful.
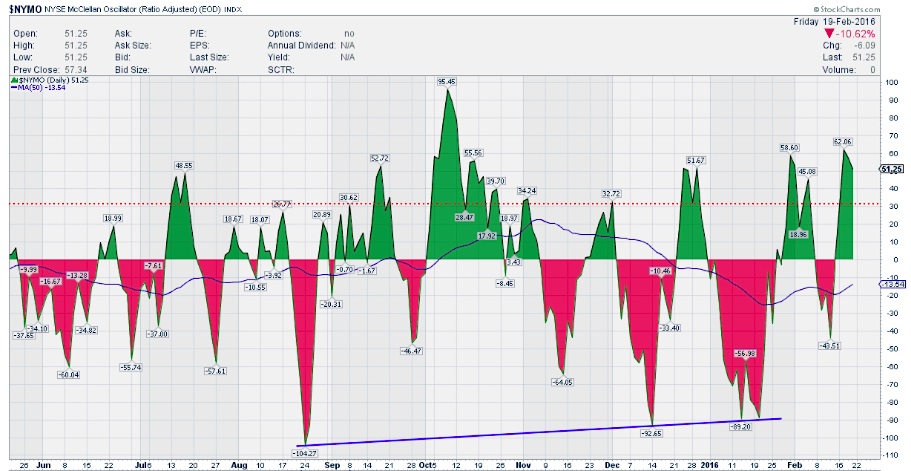
$NYMO (McClellan Oscillator):
The McClellan Oscillator took the stock market from mid-line to overbought in just a week. $NYMO did get over 60 mid week (last week) and ended the week at 51.25. A bit overbought but no edge here.
continue reading on the next page…


