Key Takeaways From Stock Market Rally:
Relative strength from equal-weight indexes and an expansion in the percentage of stocks above their 200-day average point to encouragingly broad rally participation. Deteriorating sector-level trends and a return to investor optimism suggest rally strength could soon be tested.
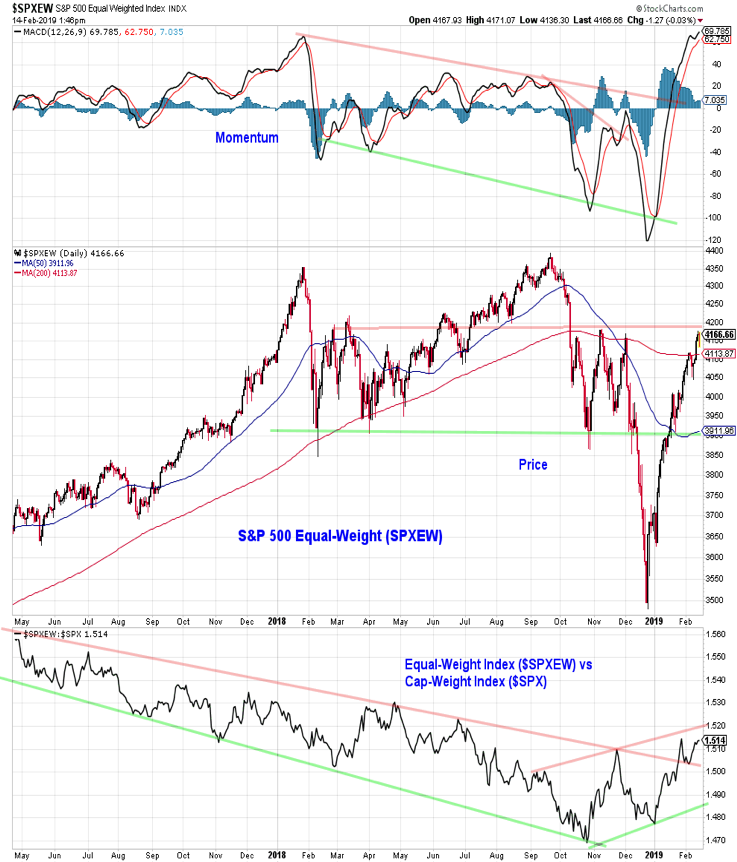
Accompanying the overall stock market rally off its late 2018 lows has been a continuation of trend that emerged over the fourth quarter of last year. The equal-weight S&P 500 has moved from lagging its cap-weight counterpart (which had benefitted from the strength of just a handful of mega-cap Technology stocks) to moving into a leadership position.
After making a multi-year low on a relative basis in October, the equal-weight S&P 500 actually made a higher low during the late-December market decline. It has followed that with higher highs on a relative basis in 2019. Momentum for the equal-weight index has soared and the index itself is already challenging the October/November price highs.
This encouraging shift in leadership suggests relatively broad participation in the rally off of the lows though it does not preclude some testing and consolidation in the weeks and months ahead.
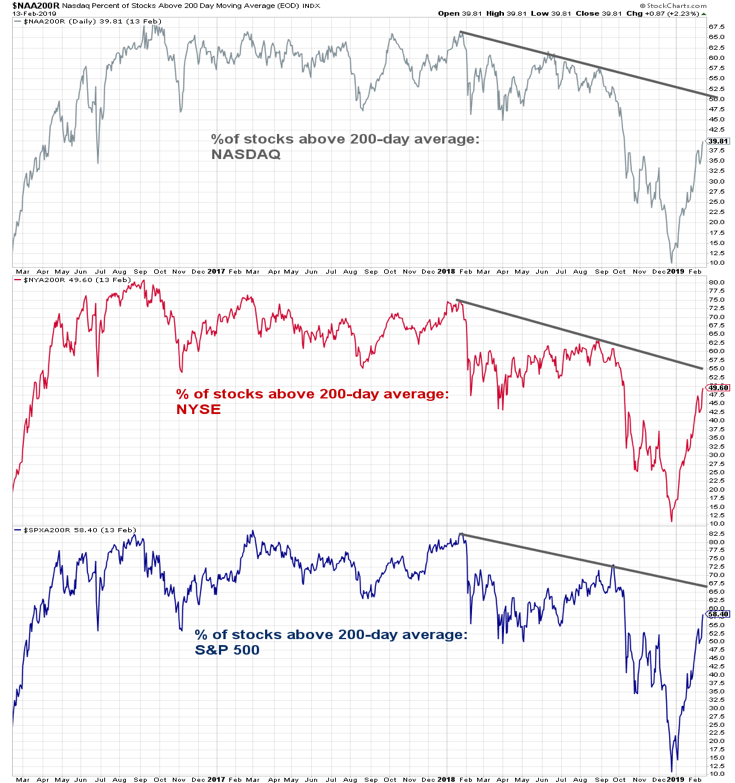
We can see additional evidence of improved performance by the average stocks when looking at the percentage of stocks trading above their 200-day moving averages. While the down-trends that emerged over the course of 2018 have not (yet) been broken, it is encouraging that the thresholds that served as resistance in October and November (52% for the S&P 500) have already been broken.
By this measure, breadth has taken something of a leadership position relative to price (the S&P 500 remains shy of the 2800 level that served as resistance from price perspective in October/November). This is encouragingly bullish evidence of ongoing healing beneath the surface. When considering the percentage of global markets trading above their 200-day average, we have yet to see similar improvement (we discuss this in the February Investment Strategy Outlook) and that is one reason that our view of breadth overall remains neutral.
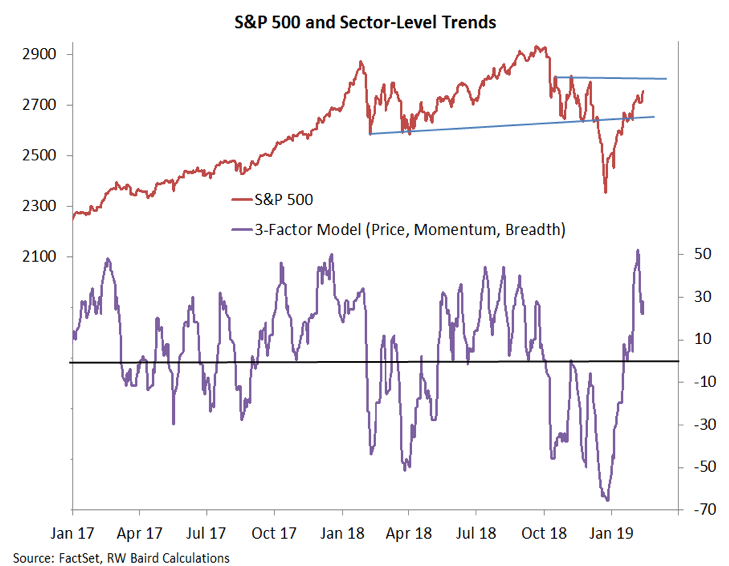
While rally participation has been improving in 2019, we have more recently seen some deterioration in sector-level trends. This could provide the first test of the rally’s strength. A failure for this indicator to stay in positive territory could signal that a meaningful re-test is underway. That alone would not negate the improving breadth trends noted above even if the near-term environment turned more volatile.
The improvement seen in the breadth indicators increases the likelihood that any testing that does emerge will be accompanied by positive breadth divergences, which would be welcome evidence of sustainable cyclical strength.
In addition to the deterioration in sector-level trends, our growing concern about a testing phase emerging comes from evidence that short-term sentiment has flipped from pessimism to optimism. The NDR Trading Sentiment Composite has moved from extreme pessimism to excessive optimism and is at a level that suggests near-term risks are elevated.
Weekly sentiment indicators are a bit more mixed. Equity funds continue to see outflows (at this time last year they we seeing record inflows). Both the Investors Intelligence data (bull-bear spread of +28%) and the NAAIM Exposure index (82%) point to elevated optimism. The weekly AAII sentiment survey shows near 40% of respondents are neutral (neither bullish nor bearish), the highest level since July.
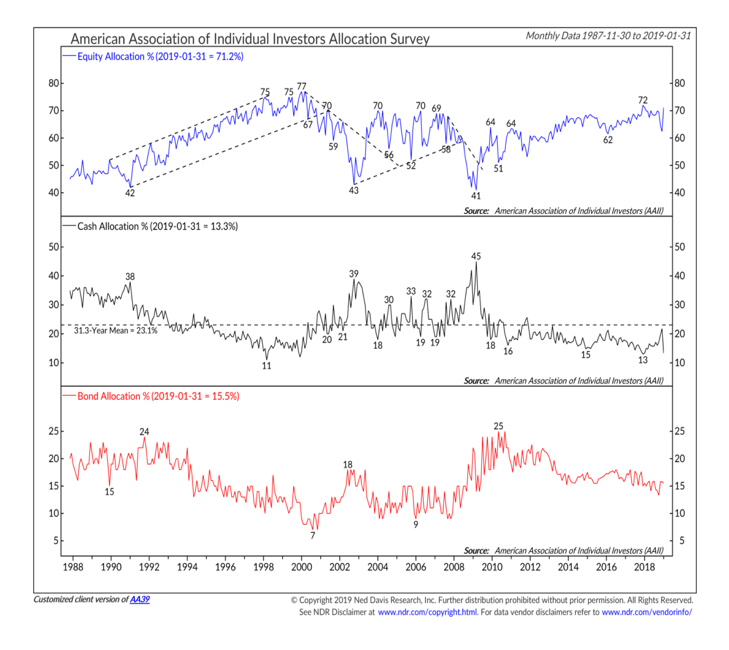
In addition to its weekly sentiment survey, however, the AAII conducts a monthly asset allocation survey. With the caveat that the sample size is small, it is nonetheless noteworthy that equity exposure (as of the end of January) has moved back toward the 2018 peak, and cash is near its lowest level on record.
Twitter: @WillieDelwiche
Any opinions expressed herein are solely those of the author, and do not in any way represent the views or opinions of any other person or entity.


