Broad Stock Market Futures Overview for July 19, 2018
Sellers are finally showing up as support areas on the S&P 500 Index (INDEXCBOE:.INX) and Nasdaq Composite (INDEXNASDAQ:.IXIC) will likely be tested and perhaps stretched lower.
That said, I am still looking for buyers to hold lower supports (see levels below). Initial supports will be difficult to hold as buyers are tired here. Patience is required here.
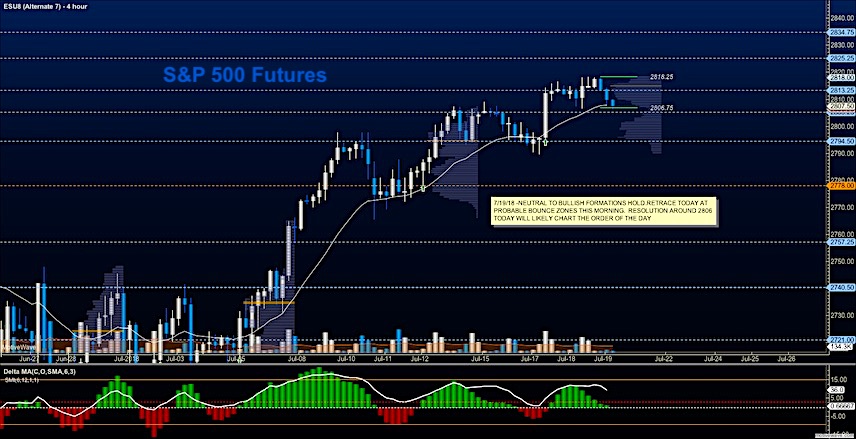
S&P 500 Futures
Tests of resistance and higher lows still hold across the board on larger time frames as we test a breakout level near 2805-2806.
Value buyers will be waiting here in these formations with tests of known support and divergence also still shows mildly. The bullets below represent the likely shift of trading momentum at the successful or failed retests at the levels noted.
- Buying pressure intraday will likely strengthen with a bullish retest of 2814.5
- Selling pressure intraday will likely strengthen with a bearish retest of 2801.75
- Resistance sits near 2810.75 to 2818, with 2824.75 and 2834.75 above that
- Support sits between 2802.25 and 2797.75, with 2790.75 and 2784.75
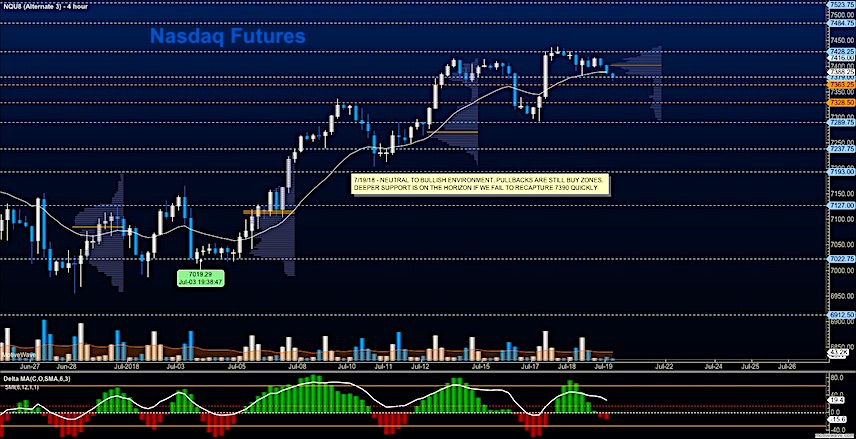
NASDAQ Futures
Deeper dips this morning after lackluster buying yesterday. Support is being tested and again, buyers look weak in the area for now. Pullbacks remain value events but watching support will be critical today. The levels of interest to me today are still between 7376 and 7408. The bullets below represent the likely shift of trading momentum at the successful or failed retests at the levels noted.
- Buying pressure intraday will likely strengthen with a bullish retest of 7414.75
- Selling pressure intraday will likely strengthen with a bearish retest of 7374.5
- Resistance sits near 7426.5 to 7438.5 with 7471.5 and 7484.25 above that
- Support sits between 7386.5 and 7364.75, with 7341.5 and 7322.75 below that.
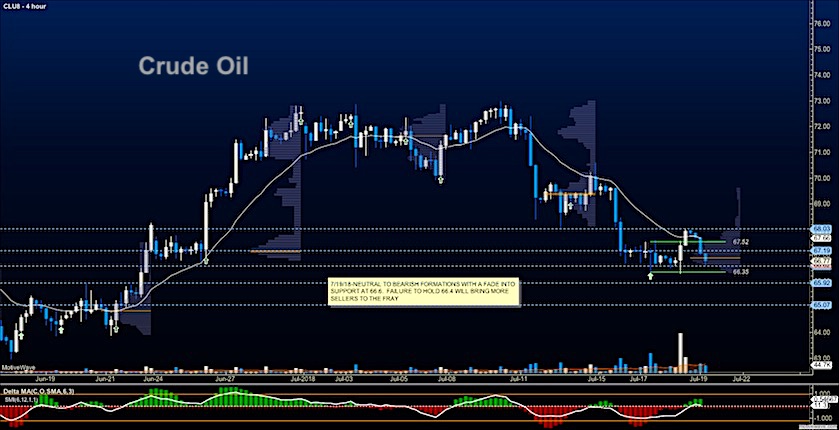
WTI Crude Oil
Buyers have stopped the bleeding this morning with the hold of the lows near 66.4. For the second day, we are holding 67 (after a break lower) and it appears that price acceptance is building here. Momentum is neutral to bearish as traders attempt a recovery. The bullets below represent the likely shift of trading momentum at the successful or failed retests at the levels noted.
- Buying pressure intraday will likely strengthen with a bullish retest of 67.28
- Selling pressure intraday will strengthen with a bearish retest of 66.57
- Resistance sits near 67.56 to 67.78, with 68.03 and 69.05 above that
- Support holds near 66.78 to 66.42, with 66.02 and 65.46 below that
You can learn more about trading and our memberships HERE.
Twitter: @AnneMarieTrades
The author trades stock market futures every day and may have a position in mentioned securities at the time of publication. Any opinions expressed herein are solely those of the author, and do not in any way represent the views or opinions of any other person or entity.

: Worrisome to Broader Market?")


