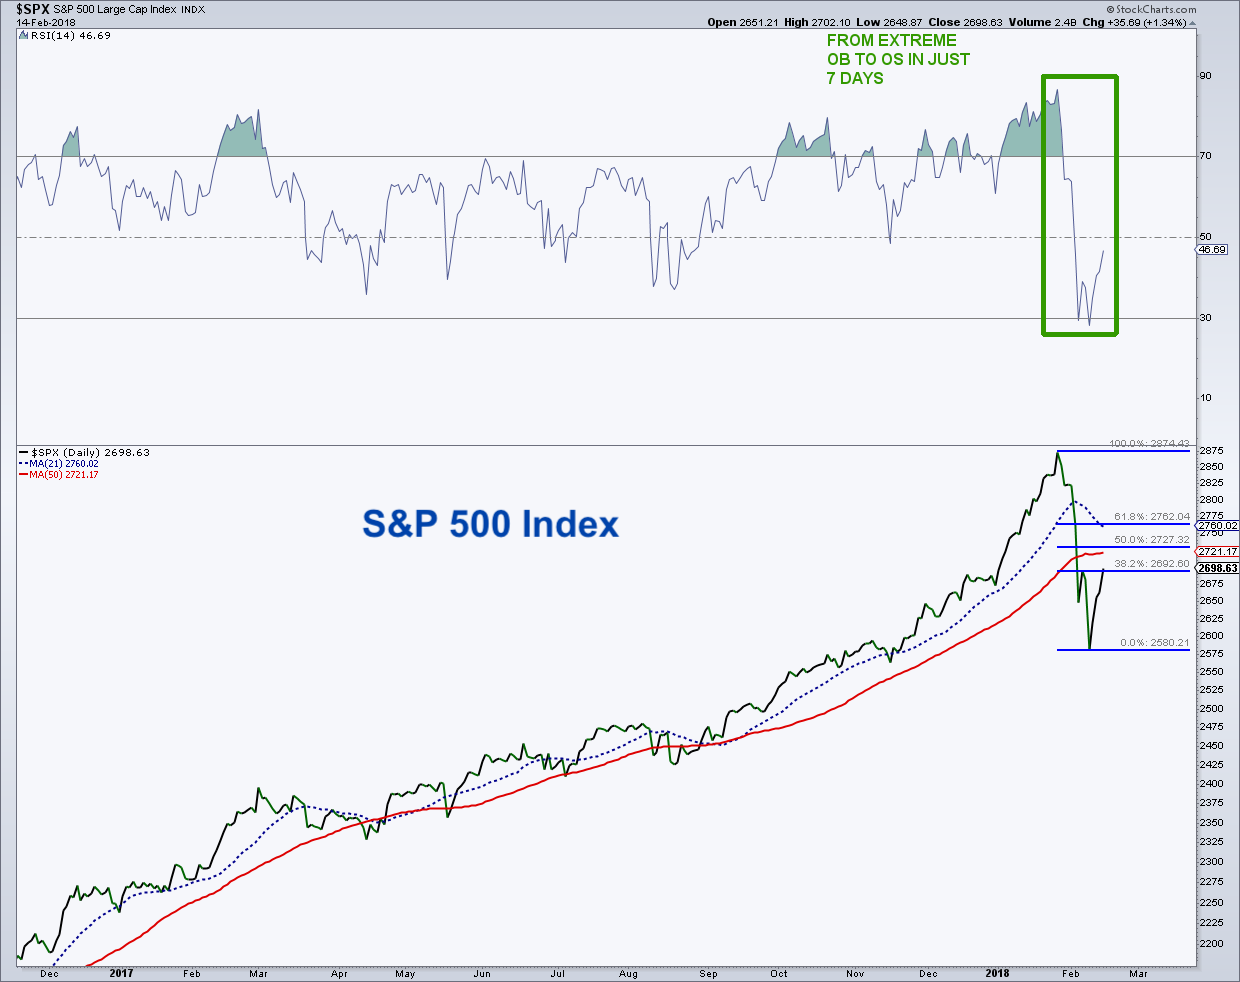
With the quick rebound, I want to show where some of the potential stopping points are on the S&P 500 Index.
I would say there is a more than 50/50 chance we rollover and test (within 1% – 2%) the recent lows.
The S&P 500 has retraced more than 38.2% of the decline based on yesterday’s closing prices. As suspected, price made it through the 38.2 level (2,693).
The next zone is the 50% Fibonacci retrace and the flat 50-day moving average around 2,721 – 2,728.
The third price area is the 61.8% Fibonacci retrace and the declining 21-day average near 2,760.
A “V” bottom is unlikely as there was a fair amount of technical damage to a lot of stocks. For shorter term oriented traders, I may take some equity exposure off around 2720-2725 and 2760. I would also look at a little hedge against potential downside.
I hope some of you were robotic and bought some stock when the “500” fell to the 200-day average about 150 S&P points ago. I outlined my S&P 500 buy targets back on January 30th. Things should continue to develop quickly as long as we are in the bottoming process. Stay focused on your plan!
Feel free to reach out to me at arbetermark@gmail.com for inquiries about my newsletter “On The Mark”. Thanks for reading.
Twitter: @MarkArbeter
The author does not have a position in mentioned securities at the time of publication. Any opinions expressed herein are solely those of the author, and do not in any way represent the views or opinions of any other person or entity.
: Creating Bullish Divergence?")


 and Semiconductors (SMH): Concerning Price Pattern?")


