We are finally getting at least a little downside traction with the S&P 500 falling a whopping 1.5% from its closing high of 2,872.87 on Friday.
It’s still early and I’m looking for more downside in the days ahead for the stock market.
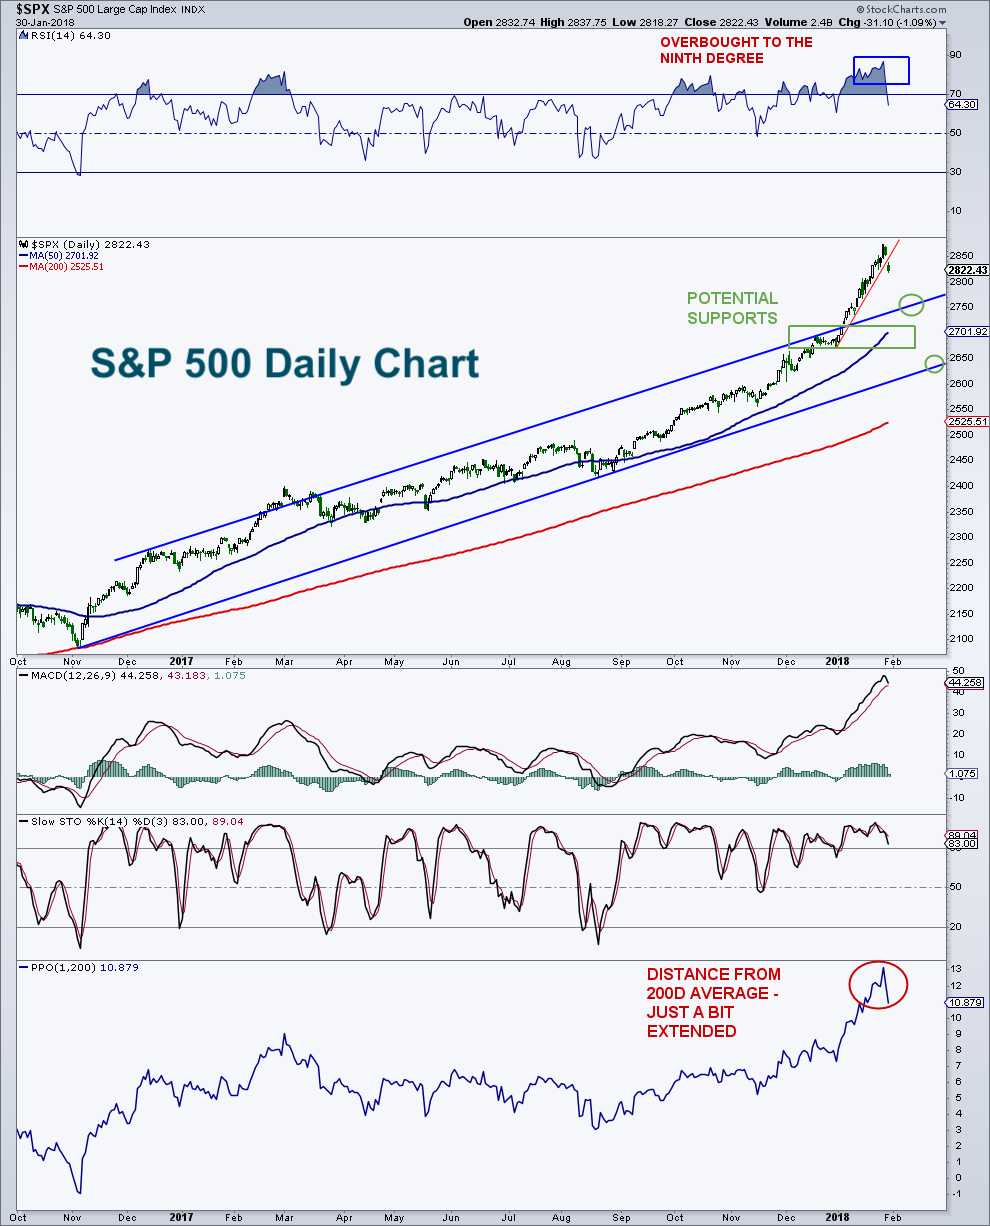
Therefore, I thought it would be a good idea to provide a quick look at the S&P 500 daily chart with some thoughts and analysis.
Market breadth has been pretty poor since late last week. In addition, investor sentiment is in desperate need of a major reset. Any stock pullback could be very quick, and potentially, very scary.
I like to use a robotic approach to increase equity exposure on the way down, especially if some panic sets in… So where am I looking?
The first price area I would increase exposure to the S&P 500 is trend line support near 2,750. The second, and a bit more interesting is the 2,685 to 2,705 zone. This range has a couple key supports including the 50-day average, a 23.6% retracement of the current wave higher, and a little chart support. The final zone is down near 2,600 where trendline support comes in along with the next Fibonacci retracement of 38.2%.
Because the stock market has rallied so far, a simple 5% pullback on the “500” would be 144 points and take the index down near 2,730. On the DJIA, 5% equates to over 1,300 points.
Feel free to reach out to me at arbetermark@gmail.com for inquiries about my newsletter “On The Mark”. Thanks for reading.
Twitter: @MarkArbeter
The author does not have a position in mentioned securities at the time of publication. Any opinions expressed herein are solely those of the author, and do not in any way represent the views or opinions of any other person or entity.
: Creating Bullish Divergence?")


 and Semiconductors (SMH): Concerning Price Pattern?")


