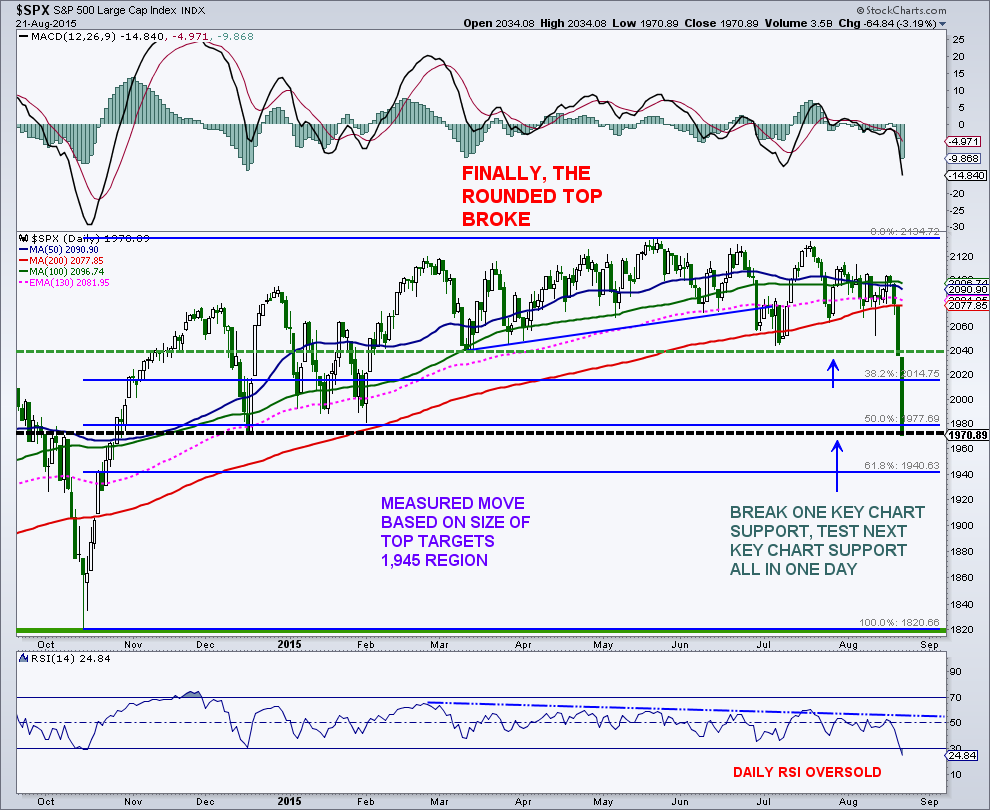
 The S&P 500 fell right to the next key support area of 1,970 on Friday, as fear and panic quickly spread to the throughout the broader market. The faster we go down, the quicker we bottom, although it certainly doesn’t feel great.
There are two scenarios (for the S&P 500) in the near- to intermediate-term that I want outline here. See charts below for reference.
The first is the potential for a strong bounce early next week that would likely be followed by a retest of the 1970 price zone. The second would be more selling on Monday morning down to the 1,945 (a measured price move based on the top in place) level which is followed by a strong rebound. Of course, it is possible that the action this year is all one part of a bigger top that is still developing, but I doubt that for two simple reasons. Market sentiment has been quick to turn on any little/moderate decline, certainly not a sign of a top. Second, the range we saw this year was very small and not indicative of a bigger market top. Bigger market tops are generally pretty volatile, even before they break down.
One thing that I’m confident in is that we will see more price volatility in stocks, etc. over the next week or so.
I don’t expect a repeat of October’s “V” bottom, although we can never rule things out. A lot of stocks have been correcting all year with some showing bottoming formations already. So these stocks could just head higher as their testing and backing and filling are already complete.
There were plenty of market indicators hitting extremes this week that suggest a bottom is near. This kind of shakeout can actually be very bullish from an intermediate-term standpoint. When investors throw in the towel and become underinvested very quickly, they are then forced to chase equities on the upside. We will see.
8 bullish factors ending the week:
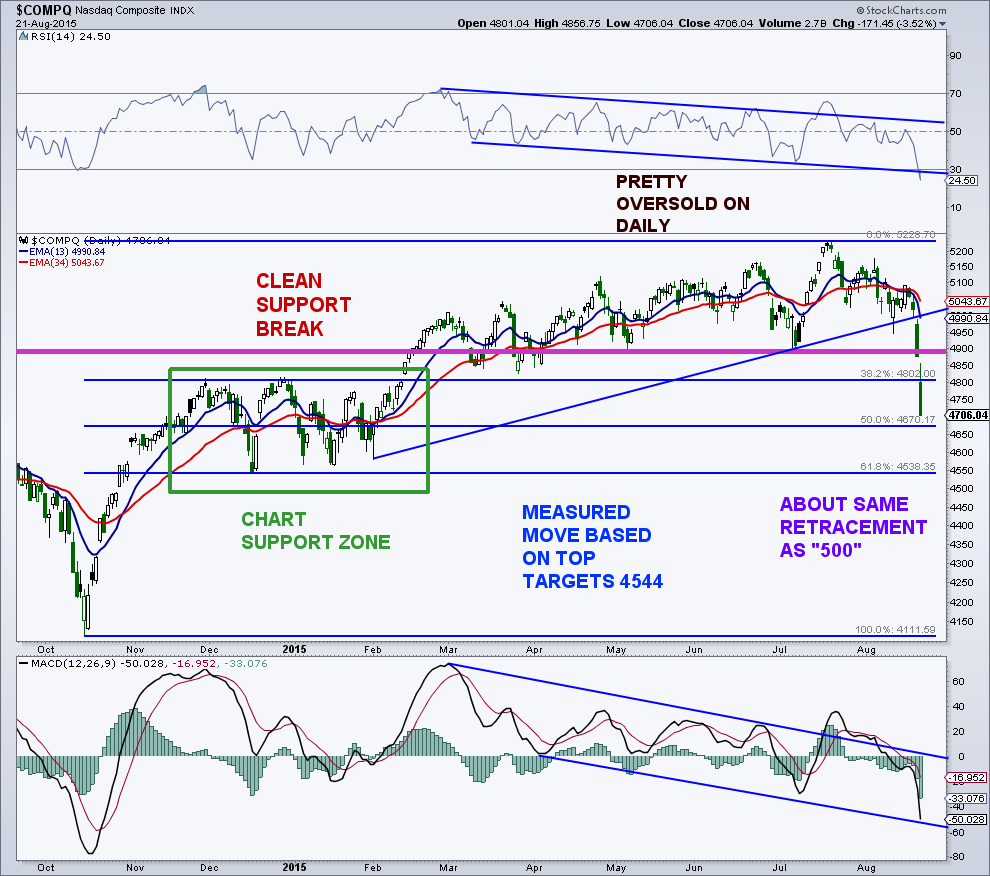
1. Daily momentum oversold for S&P 500, NASDAQ Composite, Dow Jones Industrial Average, Russell 2000, and S&P 400 MidCap with longer term bull market still in place.
2. Key support areas have been reached for the S&P 500, NASDAQ, and Russell 2000.
3. The Volatility Index (VIX) rose 118% this week, showing clear panic. Moves of this size are very rare.
4. The total put/call ratio spiked to 1.69 Friday, the highest reading dating back to 1995.
5. The Equity-only put/call ratio rose to 1.04 Friday, its highest reading since August 14, 2014 and near a market low. During a bull market, readings over 1.00 are very rare.
(#s 6-8 reference: sentimentrader.com)
6. Inverse ETF volume vs. NYSE volume set a record. The previous highs were April and October 2014, both market lows.
7. Stock/Bond Ratio. Stocks now 3 standard deviations undervalued vs. bonds. Most stretched since October 2014.
8. VIX term structure – How VIX is priced relative to futures pricing. VIX premium near 20%. So option premiums are expecting a large move now relative to the future.
If you are interested in my premium newsletter, please contact me at arbetermark@gmail.com. Thanks for reading and good luck in the week ahead.
S&P 500 Chart
NASDAQ Composite Chart
Twitter: @MarkArbeter
The author does not have a position in any mentioned securities at the time of publication. Any opinions expressed herein are solely those of the author, and do not in any way represent the views or opinions of any other person or entity.

: Cup (and Maybe Handle) Watch")
 Trading Near Top Of Price Range")

