Just a side note: Any rally that fails in the middle of the recent range, say the 1,950/1,960 region, could be a very dangerous sign for the “500.”
Why? Indices generally do not start a breakdown from the top of the range, but from the middle of the range.
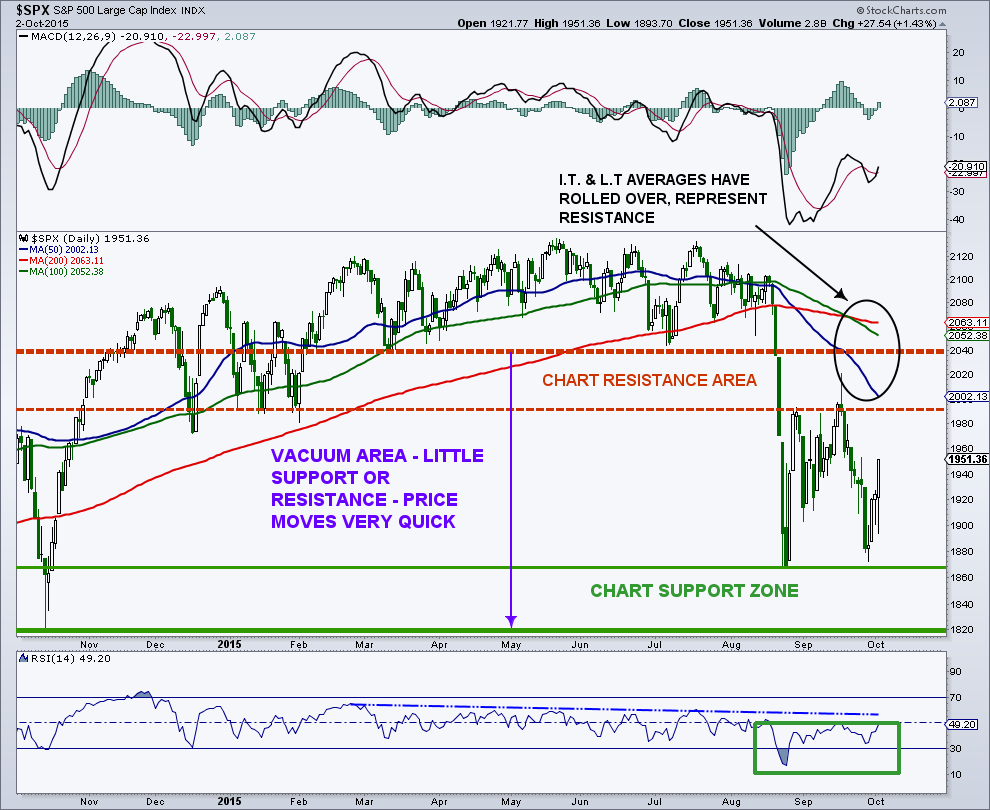
This works the other way as breakouts generally don’t start from the bottom of a wide range. Checking out the recent 2,040 to 2,135 breakdown on the “500,” we see a test of the lower part of the range on August 12, followed by a rally back into the middle of the range, and then WHACK.
S&P 500 Daily Chart (1 Year)
If any of you have an interest in my premium newsletter, please contact me at arbetermark@gmail.com.
Thanks for reading and good luck in the week ahead.
Twitter: @MarkArbeter
The author does not have a position in any mentioned securities at the time of publication. Any opinions expressed herein are solely those of the author, and do not in any way represent the views or opinions of any other person or entity.


