The S&P 500 futures have developed a trending formation –momentum is steady. And stocks are pushing higher again. Note that it is options expiration (OPEX) today.
The key S&P 500 futures support level to defend is near 2025-2027 (should the market pullback). Buyers remain in control currently as long as long as the stock market futures index holds 2025. Overhead resistance price targets lie between 2037.5-2044. Tests of this range is likely to fail and retest, before continuing in the direction of either break – deep support is likely to be defended.
Momentum on the four hour chart is positive, and holding steady – the slope of trend suggests buyers will still show up at key price support levels. Continue to watch for higher lows to continue, if buyers hold momentum and bounce price off support
Shorter time frame momentum indicators are sloping up; momentum is still positive.
See today’s economic calendar with a rundown of releases.
THE RANGE OF THURSDAY’S MOTION
Crude Oil Futures (CL_F)
The bullish action in crude oil prevailed without retracement yesterday. Momentum still holds steady, so buyers are still likely to show up.
Today, the trading ranges on crude oil futures are between 40.01 and 42.82.Breaks of these levels are likely retrace before moving again.
Moving averages in oil show mixed to slightly negative momentum on longer time frames. Resistance sits near 42.40-42.8 – it seems buyers have their eyes on that range.
Intraday long trading setups on crude oil suggest a long off 41.28 positive retest (check momentum here), or 41.68 bounce and positive retest into 42.25, 42.41, 42.78, 43.01, and if buyers hold on, we’ll see 43.12 to potentially 43.46.
Intraday short trading setups (very countertrend) suggest a short below a 41.2 failed retest with negative divergence, or the failed retest of 41.6 sends us back through targets at 41.3, 40.87, 40.45, 40.04, 39.6, and 38.87, if sellers hang on.
Have a look at the Fibonacci levels marked in the blog for more targets.
E-mini S&P 500 Futures (ES_F)
Below is a S&P 500 futures chart with price support and resistance trading levels for today. Click to enlarge.
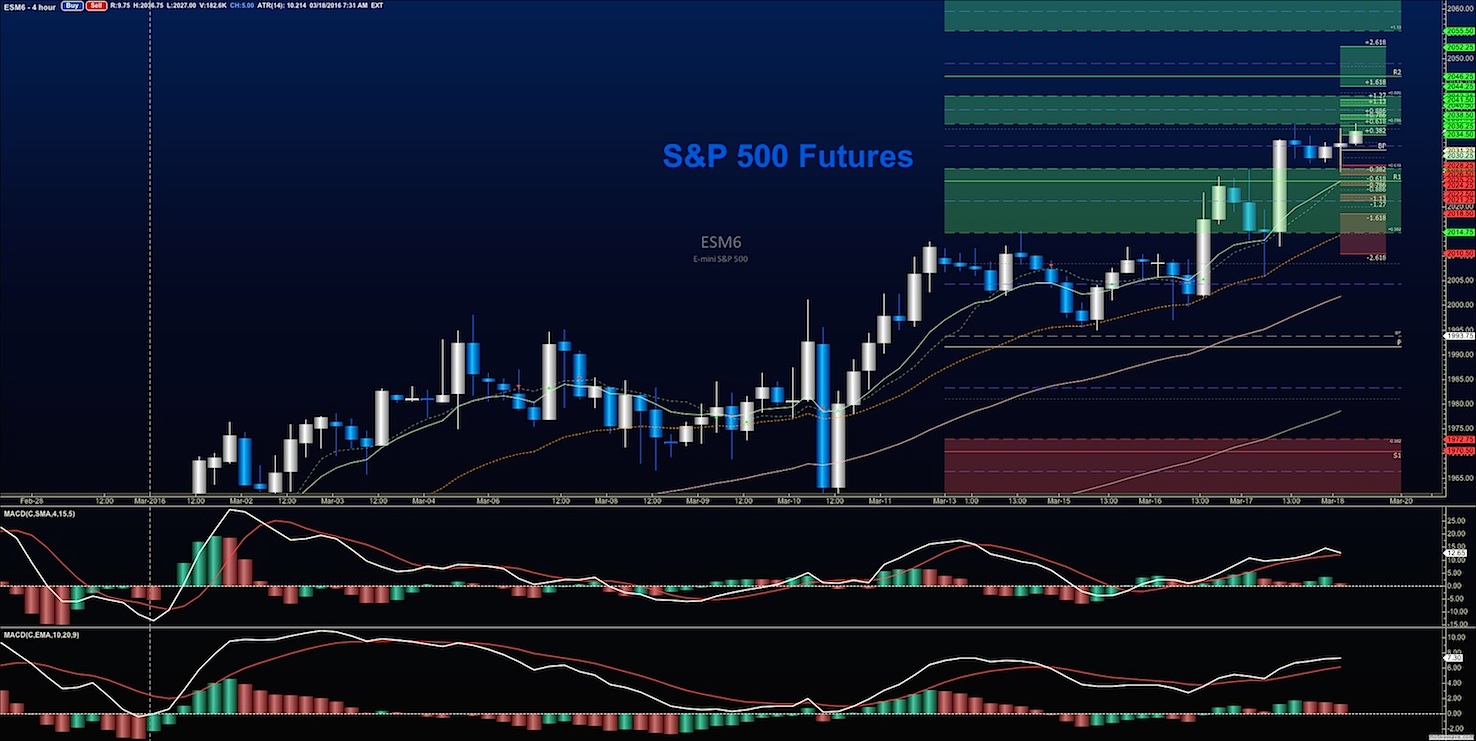
S&P 500 futures buyers defended the range of support yesterday and have bounced into resistance again. Congestion between 2029-2032 will be the region buyers will need to defend as support. 2077-2044.5 serves as front line resistance, with 2015-2019 as support.
Upside motion has the best setup on the positive retest of 2032.5 or a bounce off 2037.25 with positive momentum. I use the 30min to 1hr chart for the breach and retest mechanic. Price targets on S&P 500 futures above 2037.25 are 2040.5, 2044.5, 2047.5, 2050.5, and if we can catch a bid there, we could expand into 2054.75 and 2057.5. The higher lows will keep you on the right side of the long trade.
Downside motion opens below the failed retest of 2029 or at the failed retest of 2037 with negative divergence. Retracement into lower levels from 2029 gives us the targets 2025.5, 2021.25, 2019, 2015.5, 2012.25, 2010.25, 2005.5, 2001.75, and perhaps 1997.5 if selling really takes hold.
Have a look at the Fibonacci levels marked in the blog for more targets.
If you’re interested in the live trading room, it is now primarily futures content, though we do track heavily traded stocks and their likely daily trajectories as well – we begin at 9am with a morning report and likely chart movements along with trade setups for the day.
As long as the trader keeps himself aware of support and resistance levels, risk can be very adequately managed to play in either direction as bottom picking remains a behavior pattern that is developing with value buyers and speculative traders.
If you’re interested in the live trading room, it is now primarily stock market futures content, though we do track heavily traded stocks and their likely daily trajectories as well – we begin at 9am with a morning report and likely chart movements along with trade setups for the day.
As long as traders remain aware of support and resistance levels, risk can be very adequately managed to play in either direction as bottom picking remains a behavior pattern that is developing with value buyers and speculative traders.
Thanks for reading.
Twitter: @AnneMarieTrades
The author trades stock market futures every day and may have a position in mentioned securities at the time of publication. Any opinions expressed herein are solely those of the author, and do not in any way represent the views or opinions of any other person or entity.

: Worrisome to Broader Market?")
