S&P 500 futures stalled near resistance levels yesterday with the exception of one press upward that failed. And this could be an issue again today for stocks.
Stock market futures made a lower low over night (short term trend formation), and now traders are looking for a bounce from the 2047.5 support level. S&P 500 futures resistance levels and extended targets off this bounce are 2057.75, 2061.5, and 2067.75. Support resides between 2047.5 and 2051.5, and below that we have the 2044.5 level.
The charts look tired to me, so I do not expect any range expansions to hold. I’ll be looking to reverse long trades to short ones intraday with range moves (this is an intraday setup and there may be several times that we move both long and short within the day’s structure).
Momentum on the four hour chart is bullish, but flattening-buyers remain in control, but tighter time frames still suggest a pullback into higher support.
Shorter time frame momentum indicators are mixed – a test of support areas are on the horizon. Downside motion should be limited, however, as the balance between buyers and sellers seems even in the neutral zone.
See today’s economic calendar with a rundown of releases.
THE RANGE OF THURSDAY’S MOTION
Crude Oil Futures (CL_F)
Early morning bounce action continues from a support test near 37.6, but jammed into current resistance at 38.38. Breaching that level will be important, if the chart is to continue upside. As I suggested yesterday, the support action was tested early this morning near the 37.68 region (see yesterday’s post), and buyers actively defended this area.
Today, the trading ranges for crude oil are between 37.5 and 39.89. Breaks of these levels are likely retrace as the lower number is strong support for now, and the overall trend is still bullish on the daily time frame, though like the ES_F, charts seem tired to me.
Moving averages in oil still show continued coiling, and negative momentum on longer intraday time frames that continues to lift. Resistance is now lower between 39.89 and 39.65; deeper support is likely near 37.59 and 37.36.
Intraday long trading setups for crude oil futures suggest a long off a 38.45 positive retest (check momentum here), or 37.36 positive retest on the pullback into targets of 37.96, 38.36, 38.94, 39.46, 39.74, and if buyers hold on, we’ll see 40.1 to potentially 40.46, and 41.04.
Intraday short trading setups suggest a short below a 38.30 failed retest with negative divergence, or the failed retest of 38.89 sends us back through targets at 38.55, 38.35, 37.98, 37.69, and 37.34, if sellers hang on.
Have a look at the Fibonacci levels marked in the blog for more targets.
E-mini S&P 500 Futures (ES_F)
Below is a S&P 500 futures chart with price support and resistance trading levels for today. Click to enlarge.
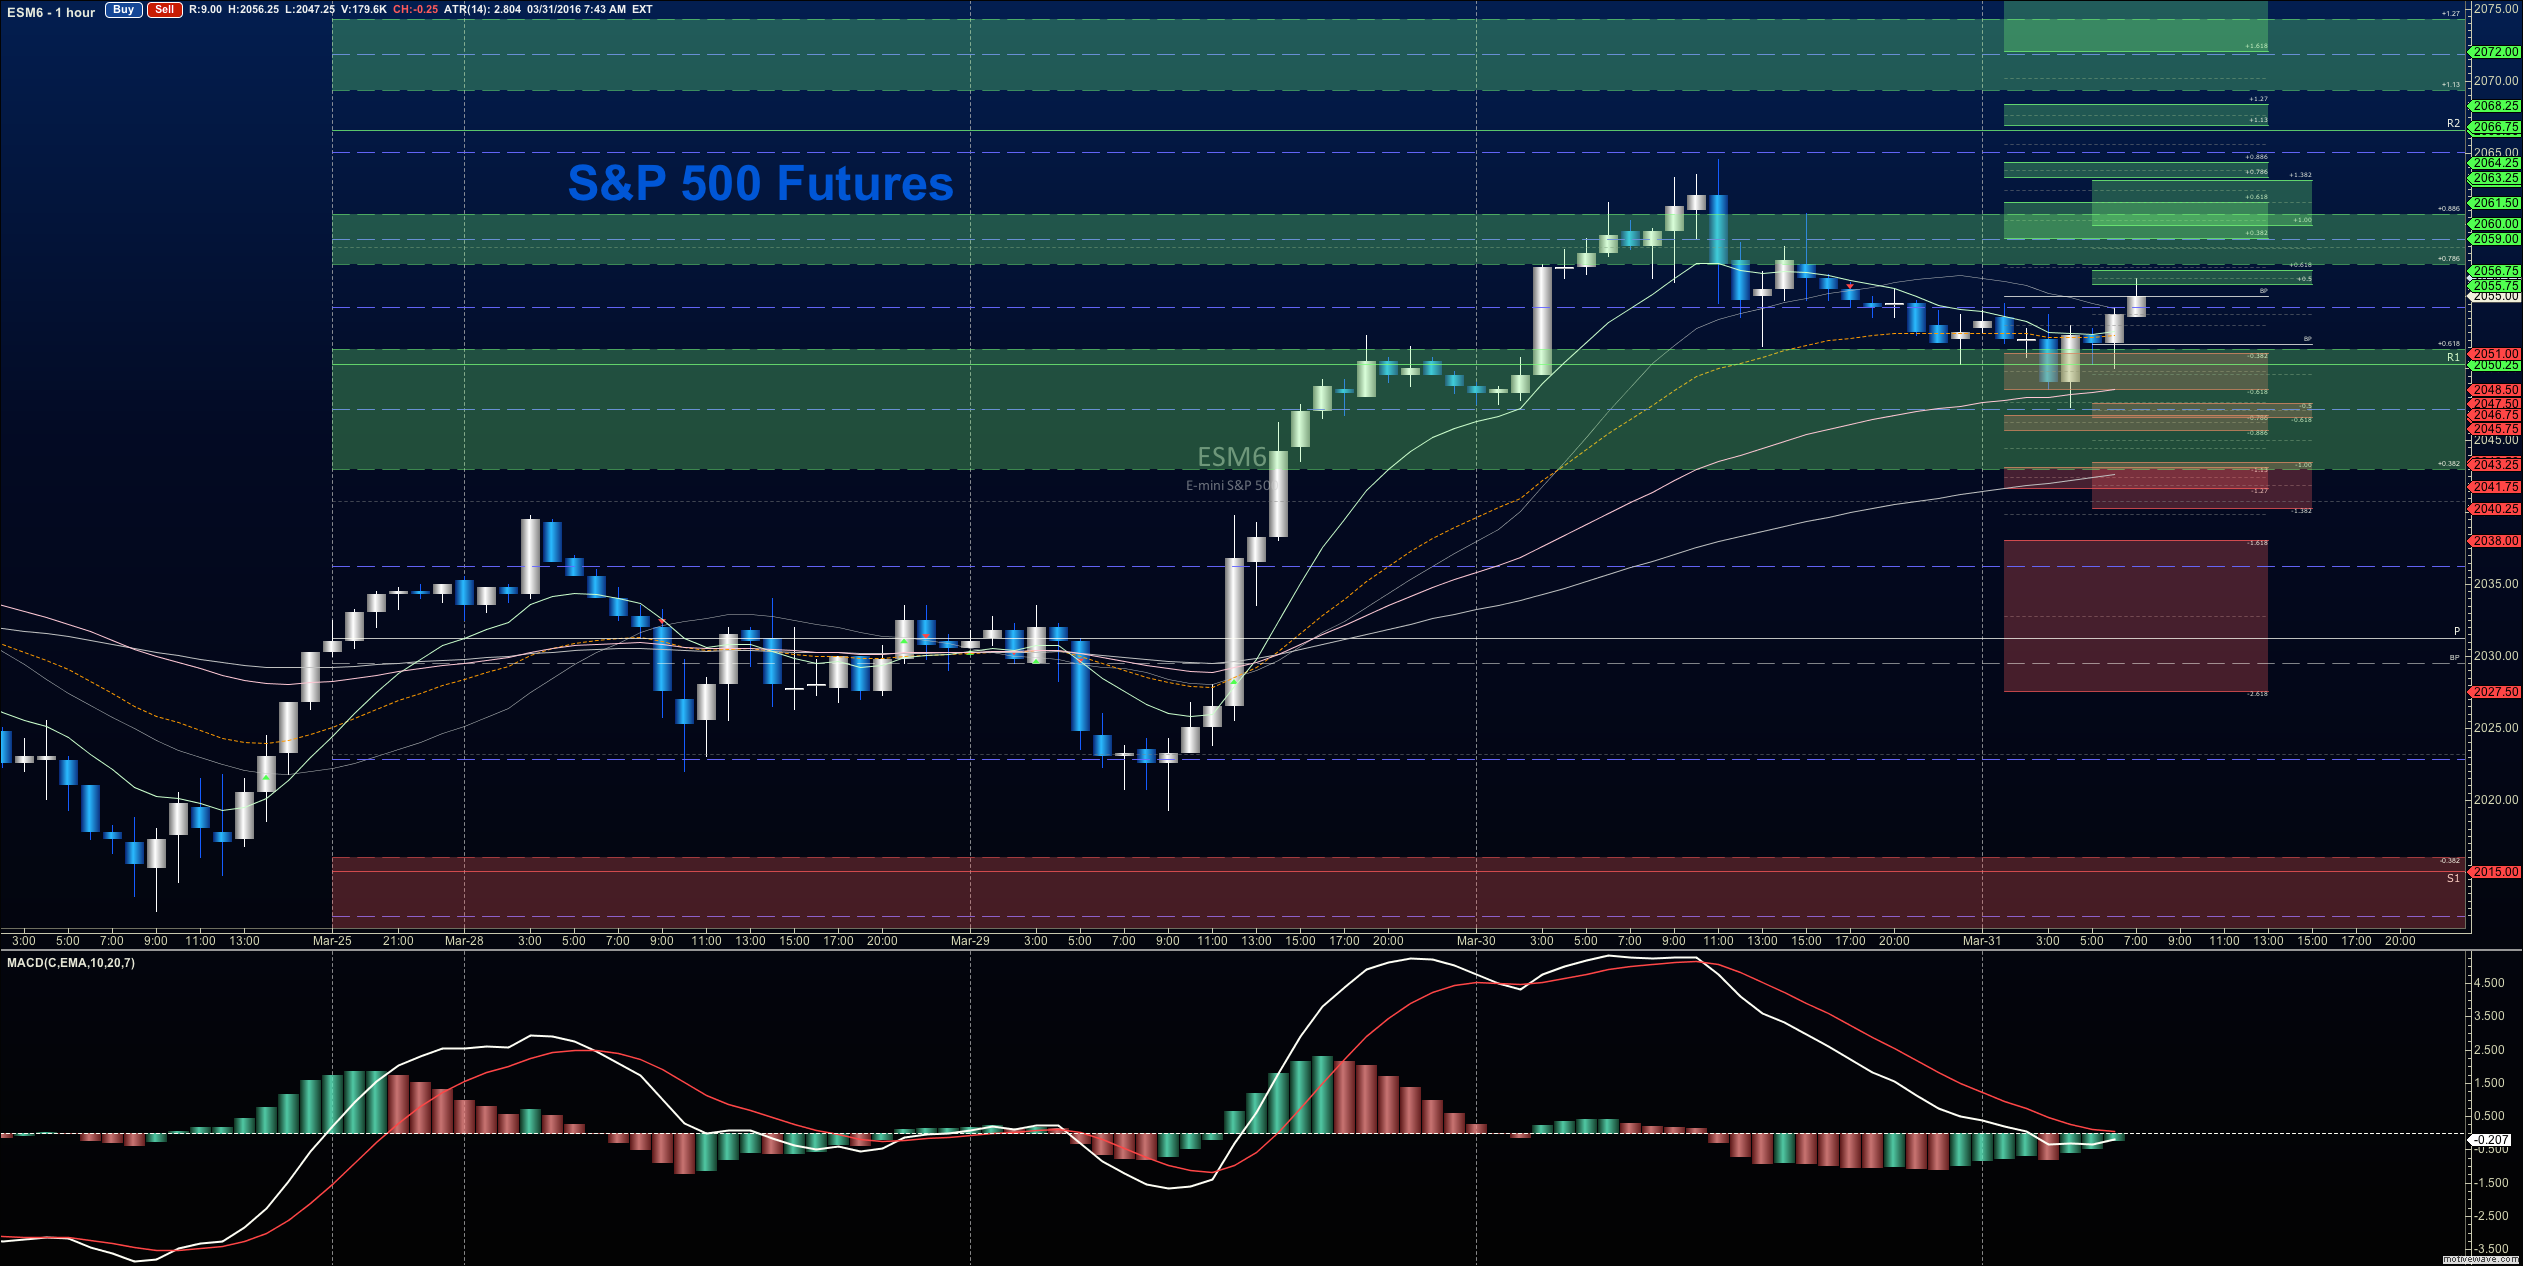
The artificial tandem that traders are building with the oil chart gave the ES_F continued lift but once again resistance near 2057.5 and 2059.75 is giving buyers trouble as overhead supply is still heavy. The levels between 2062.75- 2067.75 serve as front line resistance, with 2047- 2050.5 now as support. Stretches north could see 2069.75 (but that should create a selling opportunity short term), and deep support could be near 2040 at this point. For now, buyers are re-establishing power. The main space the chart needs to hold is 2033 for upside pressure to hold. Buyers should still come to the rescue on the pullbacks still.
Upside motion has the best setup on the positive retest of 2050.75 or a breach and retest of 2057.75 with positive momentum. I use the 30min to 1hr chart for the breach and retest mechanic. Targets from 2051.75 are 2054.5, 2057.5, 2059.5, 2061.5, 2064.5, 2067.75, and if we can catch a bid there, we could expand into 2071.5, 2074.25, and 2077.5. Longs are still trending over the bigger picture for now, but momentum remains lackluster, it should be a sideways to upward grind to the higher targets.
Downside motion opens below the failed retest of 2049.5 or at the failed retest of 2063 with negative divergence. Retracement into lower levels from 2063 gives us the targets 2060.5, 2057.75, 2054.25, 2051.75, 2047.75, 2044.5, 2041.25, 2039.75, 2035.75, 2033, and perhaps 2029.5 if selling really takes hold (clearly possible if buyers lose their footing, or lower highs continue to develop).
Have a look at the Fibonacci levels marked in the blog for more targets.
If you’re interested in the live trading room, it is now primarily futures content, though we do track heavily traded stocks and their likely daily trajectories as well – we begin at 9am with a morning report and likely chart movements along with trade setups for the day.
As long as the trader keeps himself aware of support and resistance levels, risk can be very adequately managed to play in either direction as bottom picking remains a behavior pattern that is developing with value buyers and speculative traders.
If you’re interested in the live trading room, it is now primarily stock market futures content, though we do track heavily traded stocks and their likely daily trajectories as well – we begin at 9am with a morning report and likely chart movements along with trade setups for the day.
As long as traders remain aware of support and resistance levels, risk can be very adequately managed to play in either direction as bottom picking remains a behavior pattern that is developing with value buyers and speculative traders.
Thanks for reading.
Twitter: @AnneMarieTrades
The author trades stock market futures every day and may have a position in mentioned securities at the time of publication. Any opinions expressed herein are solely those of the author, and do not in any way represent the views or opinions of any other person or entity.


