Stock Market Trading Considerations For October 11, 2017
The S&P 500 (INDEXSP:.INX) and Nasdaq Composite (INDEXNASDAQ:.IXIC) are holding in a sideways trading pattern. This will either prove to be consolidation or a rollover in momentum. Traders will want to be patient and disciplined when taking positions here. See key trading levels below.
Check out today’s economic calendar with a full rundown of releases. And note that the charts below are from our premium service and shared exclusively with See It Market readers.
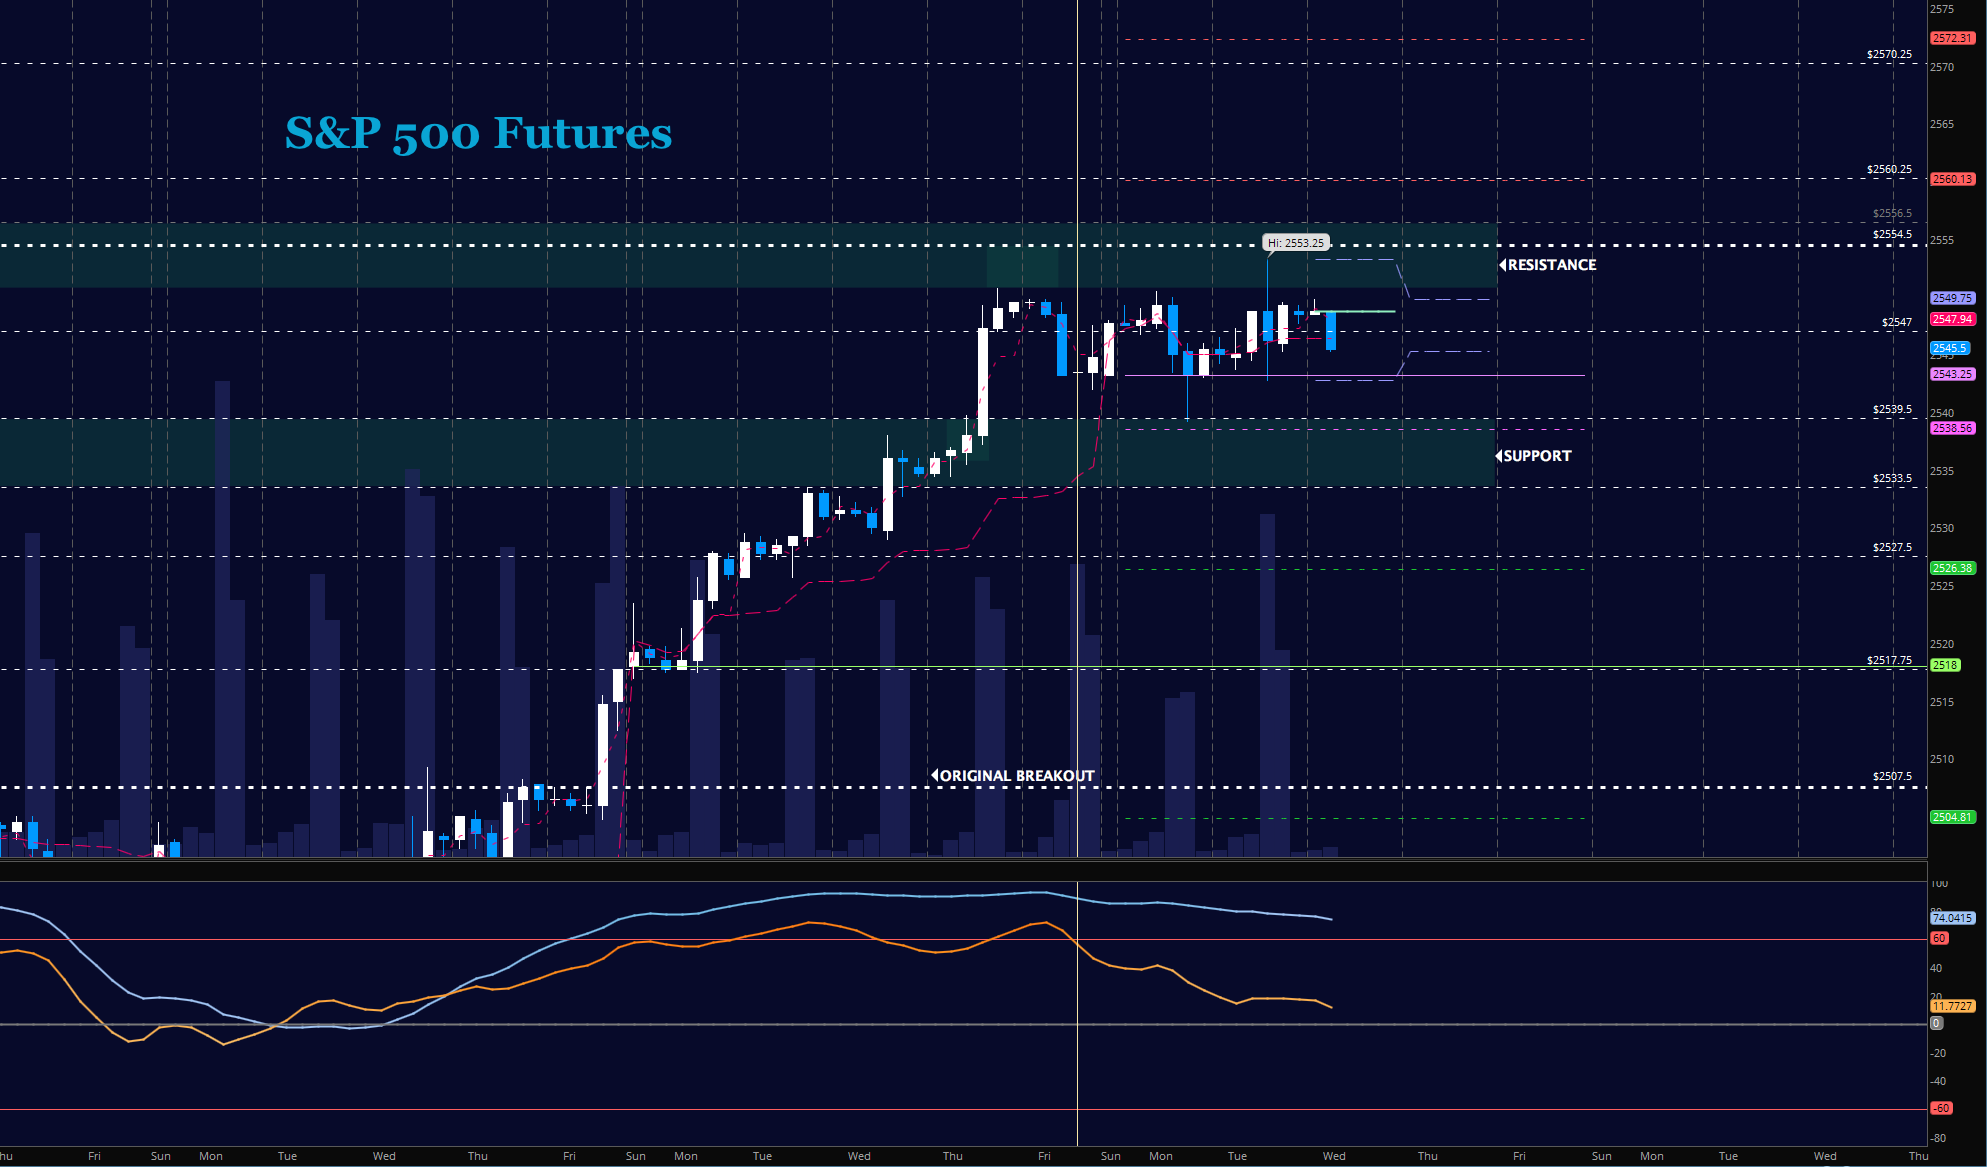
S&P 500 Futures (ES)
Charts hold above the important level of 2539.5 for the fourth day. FOMC minutes release is ahead this afternoon. Resistance, though breached, holds relatively steady as well as undercurrents upside firm. Buying at deeper support zones seem to be a low risk space for now. The bullets below represent the likely shift of trading momentum at the positive or failed retests at the levels noted.
- Buying pressure intraday will likely strengthen above a positive retest of 2548.5
- Selling pressure intraday will likely strengthen with a failed retest of 2539
- Resistance sits near 2550.25 to 2553.5, with 2556.5 and 2562.25 above that.
- Support holds between 2542 and 2539.5, with 2533.75 and 2527.75 below that.
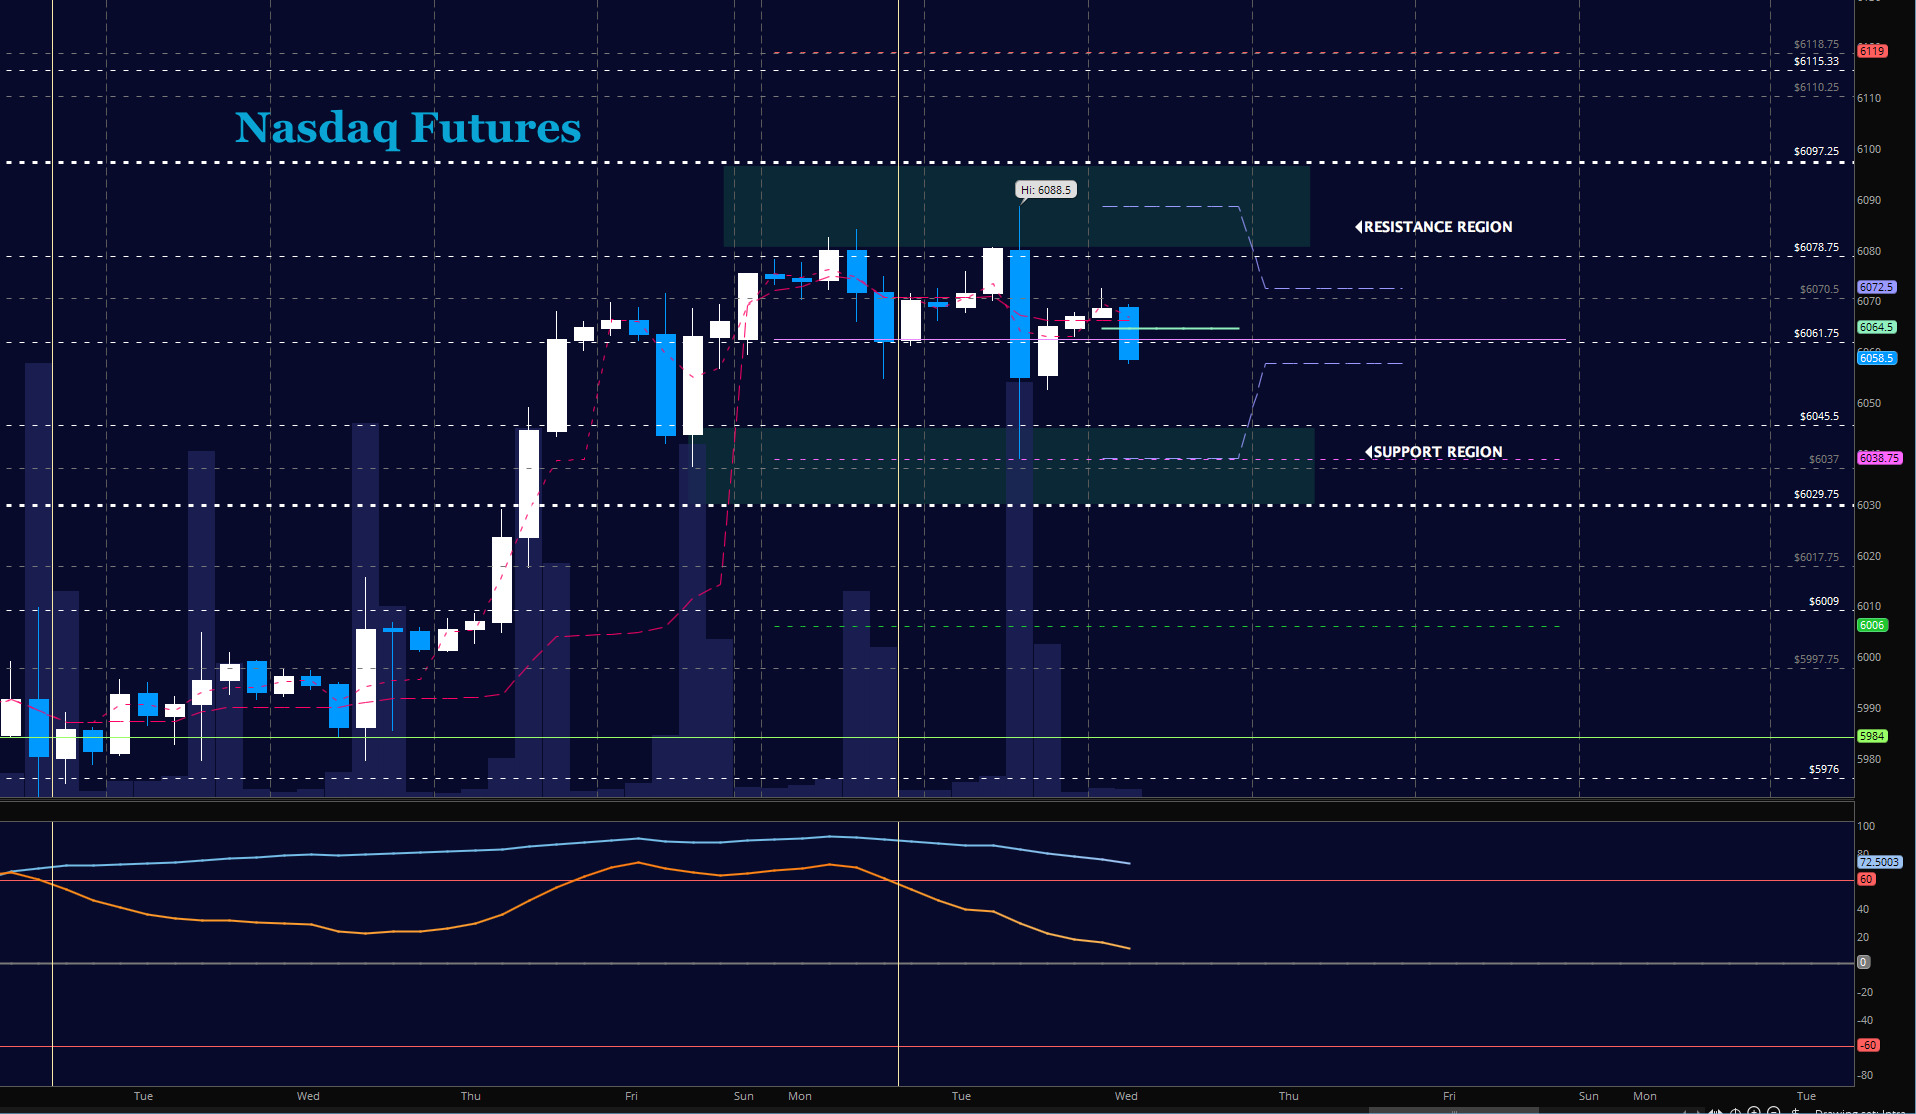
NASDAQ Futures (NQ)
Early morning highs were retraced yesterday and now lower highs are presenting. Bounces are set to fail as prices will head lower into support zones (see shaded area) Buyers need to hold 6037 for a chance to recover. Momentum looks a bit bearish today. The bullets below represent the likely shift of intraday trading momentum at the positive or failed tests at the levels noted.
- Buying pressure intraday will likely strengthen with a positive retest of 6070.5
- Selling pressure intraday will likely strengthen with a failed retest of 6053.5
- Resistance sits near 6069.5 to 6078.5, with 6088.5 and 6097.25 above that.
- Support holds between 6045.75 and 6037.5, with 6029.5 and 6009.75 below that.
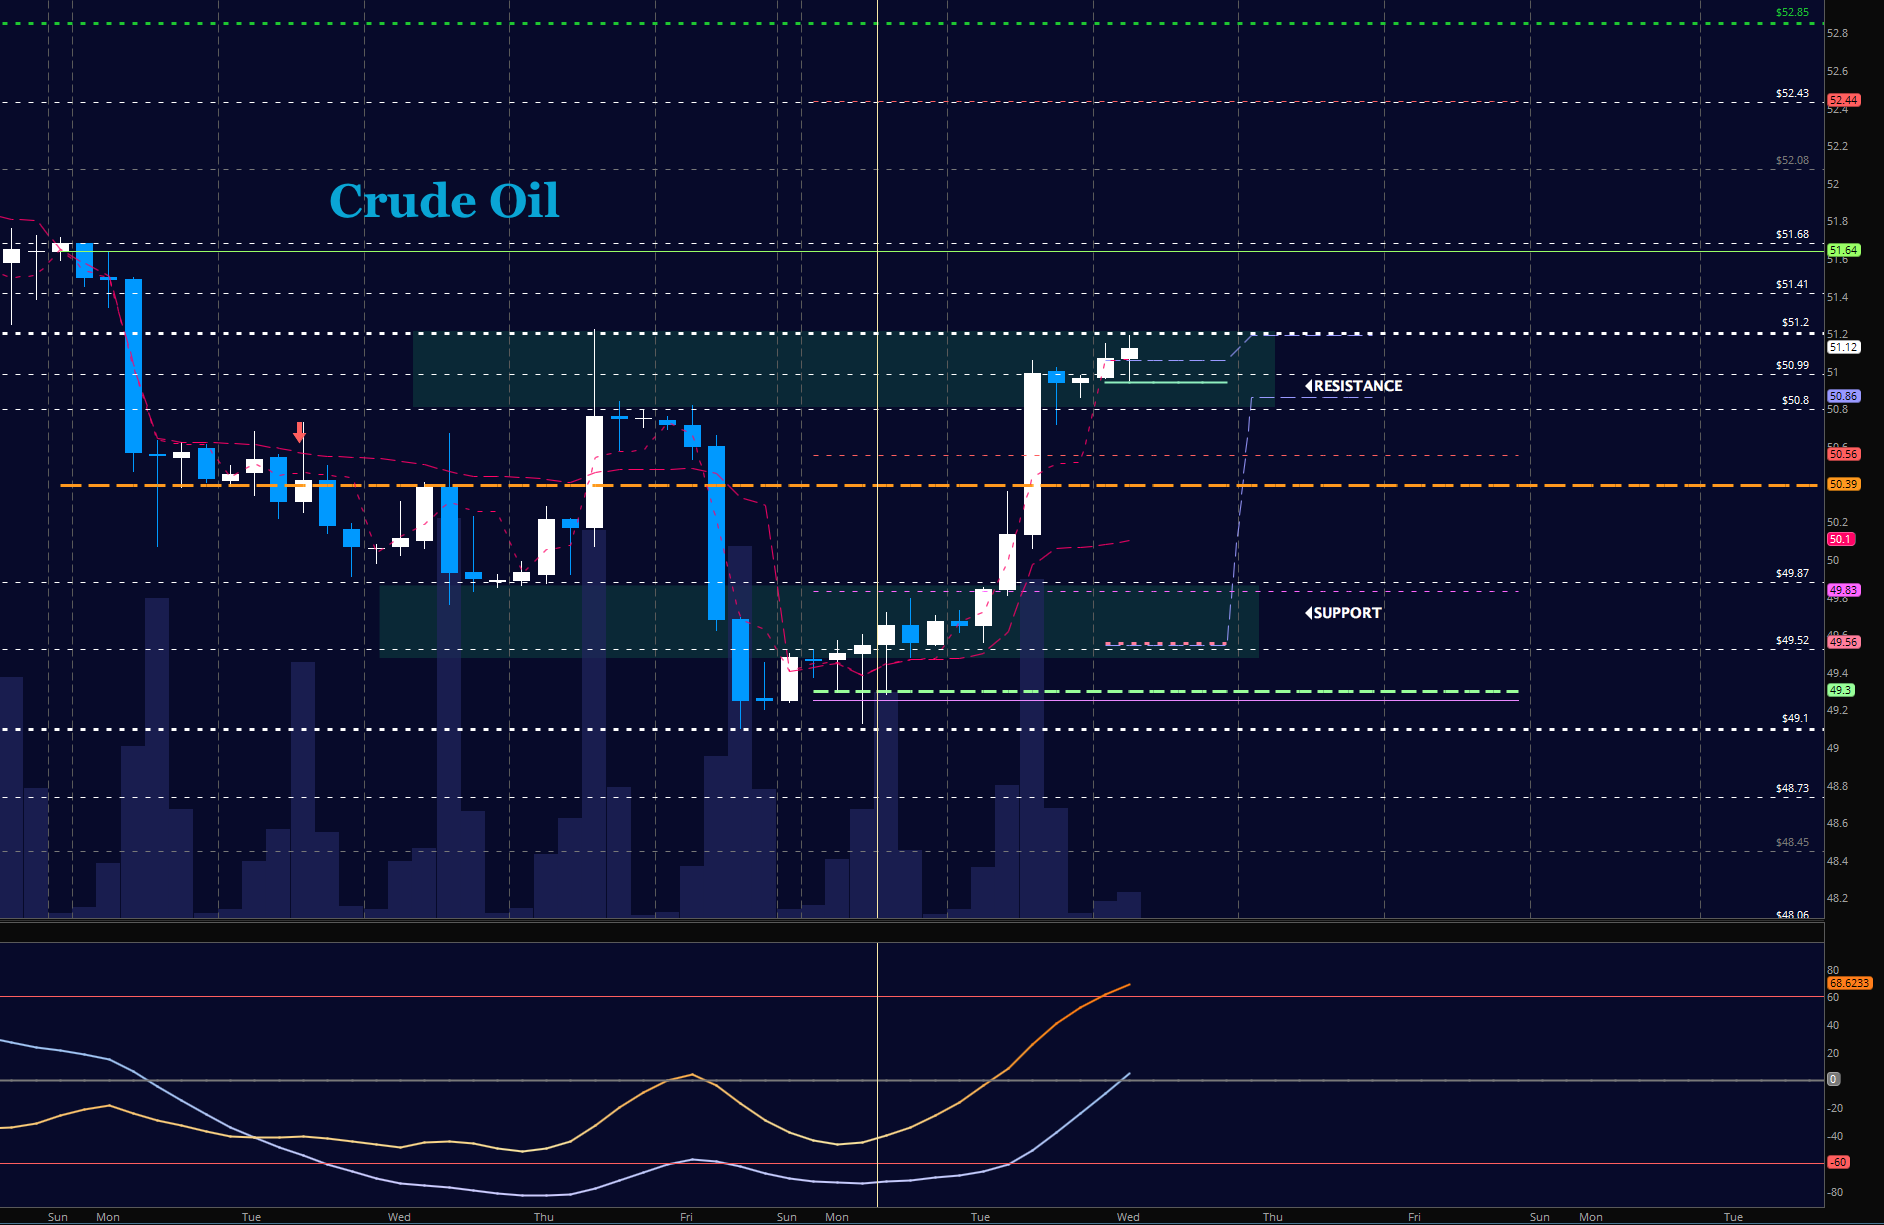
WTI Crude Oil
News feeds and the API report after hours have taken oil into key resistance areas that traders are now rejecting. New resistance ahead into the EIA report today is near 51.68 as long as traders can hold 50.74. The bullets below represent the likely shift of trading momentum at the positive or failed tests at the levels noted.
- Buying pressure intraday will likely strengthen with a positive retest of 51.22
- Selling pressure intraday will strengthen with a failed retest of 50.7
- Resistance sits near 51.2 to 51.42, with 51.68 and 52.15 above that.
- Support holds between 50.8 to 50.56, with 50.2 and 49.87 below that.
If you’re interested in the live trading room, it is now primarily stock market futures content, though we do track heavily traded stocks and their likely daily trajectories as well – we begin at 9am with a morning report and likely chart movements along with trade setups for the day.
As long as the trader keeps himself aware of support and resistance levels, risk can be very adequately managed to play in either direction as bottom picking remains a behavior pattern that is developing with value buyers and speculative traders.
Twitter: @AnneMarieTrades
The author trades stock market futures every day and may have a position in mentioned securities at the time of publication. Any opinions expressed herein are solely those of the author, and do not in any way represent the views or opinions of any other person or entity.


