Stock Market Trading Considerations For October 12, 2017
The S&P 500 (INDEXSP:.INX) is trading flat again, so traders need to be mindful of the levels and buyers and sellers reaction to these levels. See my thoughts and key trading price levels below for S&P 500, Nasdaq, and crude oil.
Check out today’s economic calendar with a full rundown of releases. And note that the charts below are from our premium service and shared exclusively with See It Market readers.
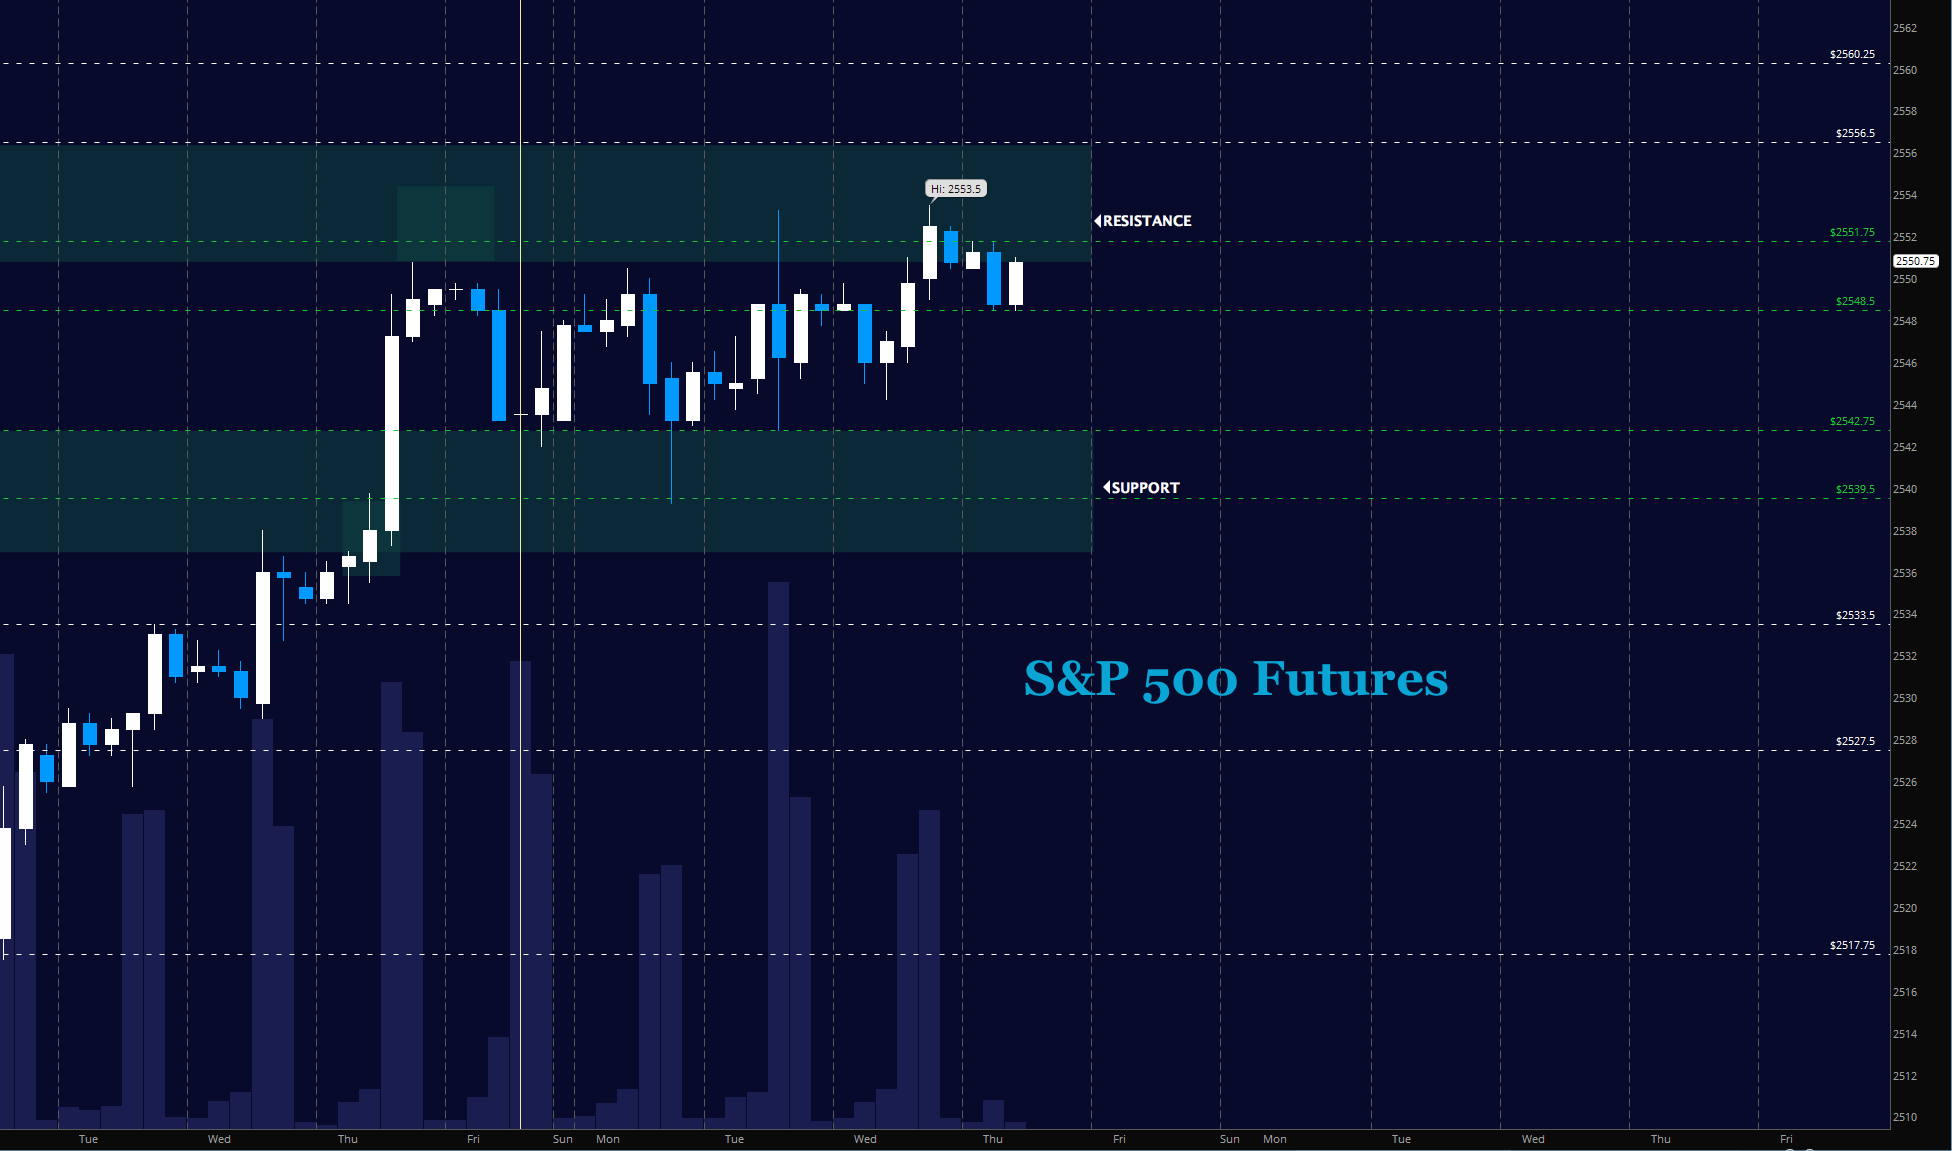
S&P 500 Futures (ES)
The e-mini’s pushed through near-term resistance yesterday but faded in the early morning back to another higher low we see at 2548.5. Both support and resistance are higher today, suggesting more grinding upside on the horizon. The bullets below represent the likely shift of trading momentum at the positive or failed retests at the levels noted.
- Buying pressure intraday will likely strengthen above a positive retest of 2551.75
- Selling pressure intraday will likely strengthen with a failed retest of 2542.75
- Resistance sits near 2551.75 to 2553.5, with 2556.5 and 2562.25 above that.
- Support holds between 2542 and 2539.5, with 2533.75 and 2527.75 below that.
NASDAQ Futures (NQ)
This chart seems to be firming up into heavy earnings on the horizon with information suggesting that bullish formations are still leading us. Lower highs are presenting but holding higher lows. The bullets below represent the likely shift of intraday trading momentum at the positive or failed tests at the levels noted.
- Buying pressure intraday will likely strengthen with a positive retest of 6084.5
- Selling pressure intraday will likely strengthen with a failed retest of 6060.5
- Resistance sits near 6084 to 6088.5, with 6092.25 and 6097.25 above that.
- Support holds between 6060.75 and 6053.5, with 6043.25 and 6029.75 below that.

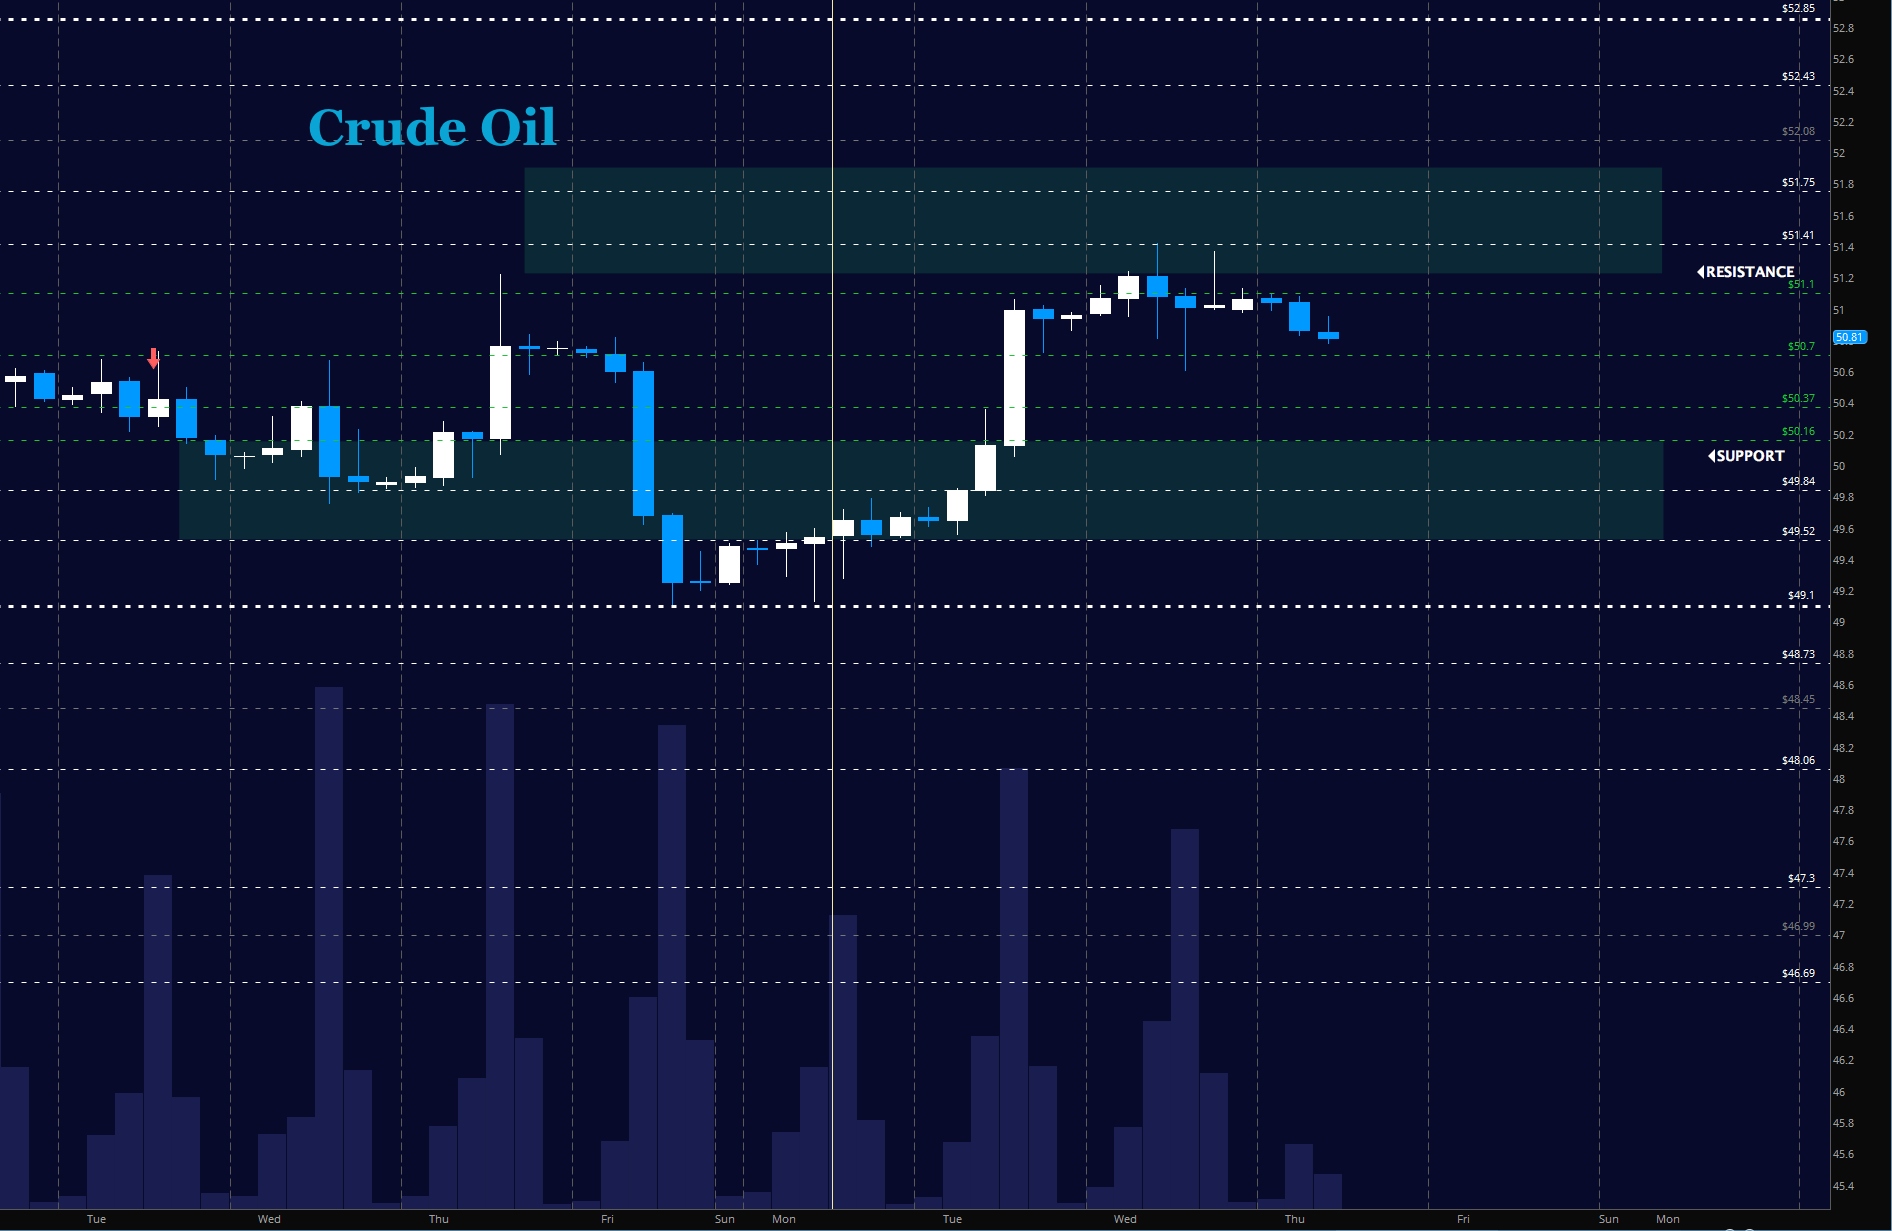
WTI Crude Oil
News feeds and the API report after hours have taken oil into key resistance areas that traders are now rejecting. New resistance ahead into the EIA report today is near 51.68 as long as traders can hold 50.74. The bullets below represent the likely shift of trading momentum at the positive or failed tests at the levels noted.
- Buying pressure intraday will likely strengthen with a positive retest of 51.12
- Selling pressure intraday will strengthen with a failed retest of 50.69
- Resistance sits near 51.4 to 51.68, with 51.87 and 52.1 above that.
- Support holds between 50.7 to 50.37, with 50.18 and 49.84 below that.
If you’re interested in the live trading room, it is now primarily stock market futures content, though we do track heavily traded stocks and their likely daily trajectories as well – we begin at 9am with a morning report and likely chart movements along with trade setups for the day.
As long as the trader keeps himself aware of support and resistance levels, risk can be very adequately managed to play in either direction as bottom picking remains a behavior pattern that is developing with value buyers and speculative traders.
Twitter: @AnneMarieTrades
The author trades stock market futures every day and may have a position in mentioned securities at the time of publication. Any opinions expressed herein are solely those of the author, and do not in any way represent the views or opinions of any other person or entity.


")

 Rolling Over At Key Fibonacci Level?")

