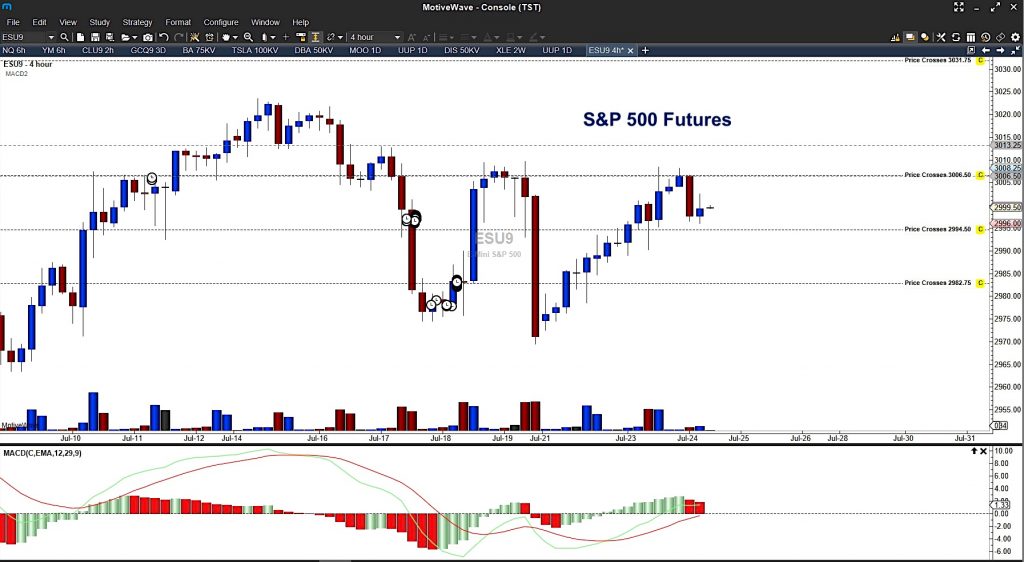
S&P 500 Futures Trading Chart – July 24
The count goes to 11 trading days as the S&P 500 Index (INDEXSP: .INX) continues to trade rangebound into the Federal Reserve release- 3008 to 2971 – with buyers showing up at the key levels of the support and moving north into resistance.
Range based bounces should continue but with negative drift, we should see lower highs.
The stock market will only reverse this negative drift if it trades several days over 3016.
Divergence still exists – and our price levels of note still remain important – 3006, 2993, and 2974. The break below 2992 will signal that further dips if the bounce fails and then continuing to 2974 brings 2761 to view.
Gold holds higher lows and in ping pong fashion is again back above breakout territory of 1422. Bitcoin and cryptos are under pressure – likely from general unrest in the space and all the big tech under pressure.
The US Dollar grinds back above 97, another key level and is holding steady for now. The Fed release news will surely give it a solid pop but that pop should fade (in my mind anyway, if I look at the big picture) . Oil continues to hold 56 -a very key breakout level- as we step into the EIA this morning.
THE BIG PICTURE – Daily momentum is mixed and neutral to positive and with some divergence. The breach and hold of support areas near 3006 will need to be hold if we are to move out of the range. Below 2992, we’ll gain more traction back into support regions noted above near 2974.
INTRADAY RECAP – Neutral as traders hold support above and bounce off 2993 but fail to breach 3008. Watching the support levels near 2993 and 2974 in the ES_F are on my radar today below, and 3006 to 3014 above.
TOO MANY TESTS OF SUPPORT WILL MAKE BULLISH ACTION MUCH MORE DANGEROUS – ESPECIALLY AS A SHORT WEEKLY TRIGGER HAS ENGAGED AT THE 3006.75 LEVEL. 1ST PROFIT TGTS ARE 2997.25 AND 2989.75. WE’LL BE TRADING AROUND THIS POSITION UNTIL THE CHART EITHER BREAKS DOWN OR THE UPSIDE MOTION CONTINUES.
Twitter: @AnneMarieTrades
The author trades stock market futures every day and may have a position in mentioned securities at the time of publication. Any opinions expressed herein are solely those of the author, and do not in any way represent the views or opinions of any other person or entity.

: Worrisome to Broader Market?")


