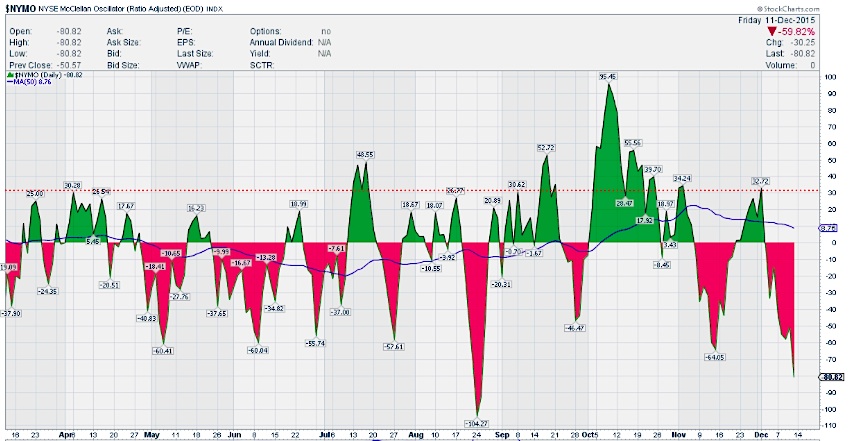
McClellan Oscillator: $NYMO
The McClellan Oscillator $NYMO finished the week negative at -80.82, extremely oversold.
This likely opened the door for the rally early this week. However, if it wants to go lower, it can – see August.
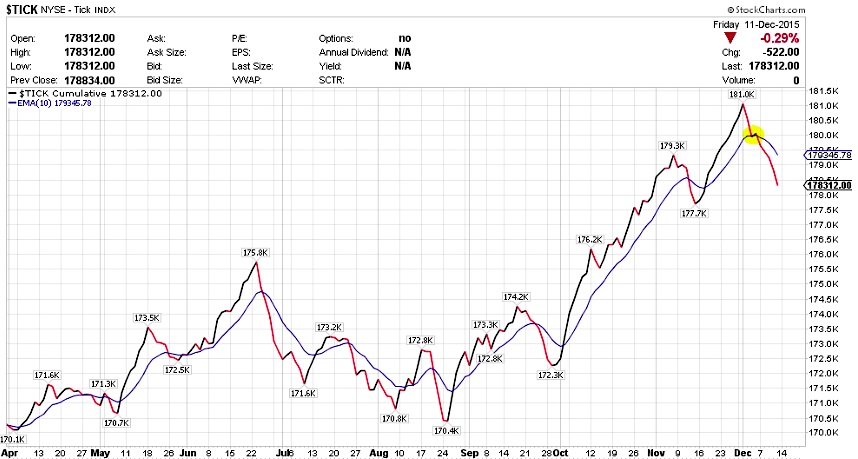
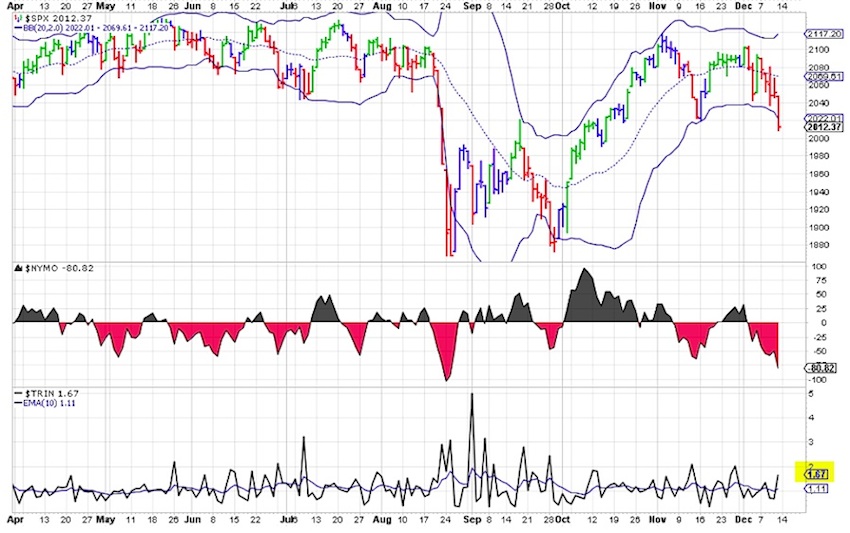
$TRIN & $TICK Indicators:
$TRIN finished elevated at 1.67. For most part of the mid week, it was holding lower around 0.55-.80 but then on Friday, it started moving higher. Nothing to look in $TICK, just continued falling making more negative -800 entire week.
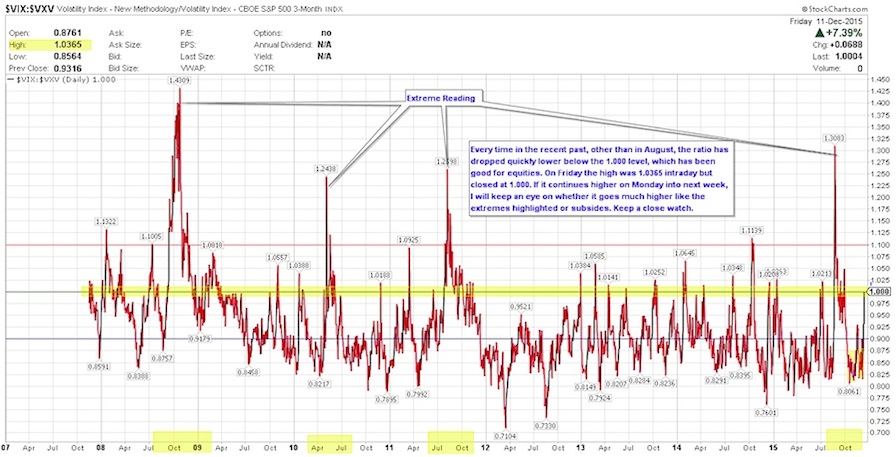
$VIX:$VXV Volatility Term Structure:
$VXV is the 3 month volatility index. The relationship between $VXV and $VIX (30 day volatility) or the ratio between them if > 1.00 often spells trouble for equities.
The chart below is from inception of this ratio. This ratio is right at 1.00 although it was at 1.0365 intraday Friday. This is a not a great sign if you are a bull. Watch to see whether it turns back down this week like the past few times or if it just goes and hits one of those extreme points.
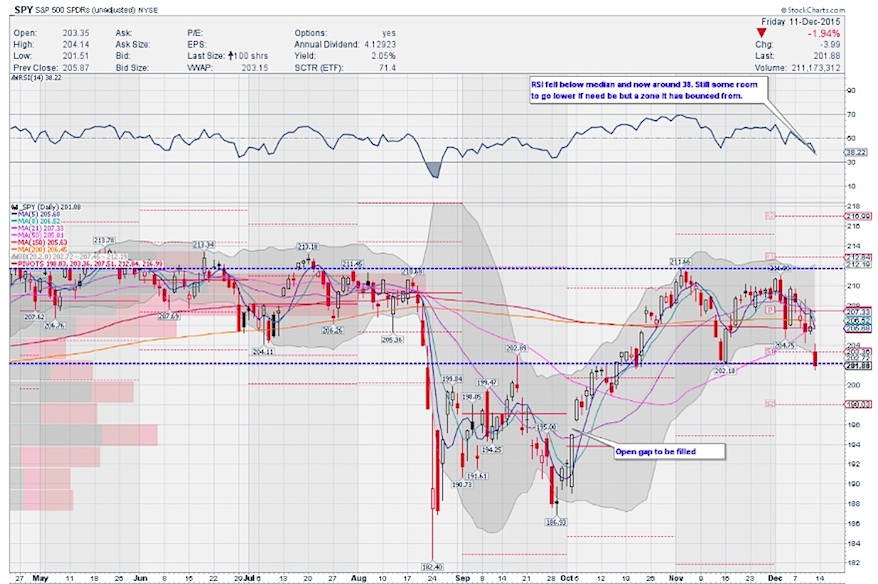
S&P 500 ETF (SPY) Daily Timeframe:
The S&P 500 ETF (SPY) received absolutely no respite last week. Note the FOMC or Crude Oil or Junk bonds or Yen or anything. It was just plain ugly.
Holding 200 this week will be constructive but that is just a number after all. There’s a gap at 195 that may get filled at some point. Nothing goes down or up in a straight line and counter-trend move is possible with very oversold technical indicators plus sectors. We now have a lower low to add to the lower highs. Price is below all moving averages with the shorter term MAs sloping lower. Price is below the lower Bollinger band and the Bollinger Bands have opened towards the downside.
From a momentum indicators perspective, RSI is falling and now well below median. Not quite oversold yet, so there is more room if it wants to fall, but a countertrend is expected. MACD crossed lower but above median. Slow STO is in oversold territory but can get embedded if need be. While all these support more downside, a bounce to resistance is possible. If we get a bounce, it will be interesting to see what happens around 204-205.68.
You can read more of my weekly analysis on my website. Thanks for reading and have a great week.
Twitter: @sssvenky
The author has a position in S&P 500 related securities. Any opinions expressed herein are solely those of the author, and do not in any way represent the views or opinions of any other person or entity.

: Showing Some Signs of Emerging Strength")
