Last week was a huge down week and many were caught by surprise. It seemed as though Buyers were on strike. Stocks were down a bunch with the S&P 500 ETF (SPY) down about 3.69 percent, Nasdaq 100 ETF (QQQ) down 3.78% and the Russell 2000 ETF (IWM) down 4.98% – still the laggard.
The Volatility Index (VIS) spiked while crude oil shed over 11% in a week. Crude was a catalyst for the selloff along with High Yield (HYG) and Junk Bonds (JNK).
Crude Oil closed last week below $36, a level not seen since 2009. Lot of talks of potential defaults in this space. Could this also be the start of a bond market panic or an isolated event? The pain returns when the past is remembered (eerily similar to 2007). Also Emerging Market currencies are weakening, something to be aware of.
Well I’ve had quite a few traders reach out and ask if the Federal Reserve will really raise hikes with markets acting like this. The Fed is in a quiet period and can’t communicate until after the meeting / decision and hence there is instability all around. They will surely be keeping an eye on the emerging market currencies.
The Federal Reserve is expected to raise rates but the larger question is will there be any surprises? Has the market fully priced in a rate hike?
I really don’t know but if it has and the Fed surprises by not raising the rates, brace yourself for a potential huge rally. As always, I will wait for the event to be over and after the first 2-3 moves, will trade the reaction to it. All I can say at this point is that the theme of “Trendless Markets” continues. If you haven’t read my post from last week, here’s the link: “S&P 500 Weekly Review: Mr. Market Searching For A Trend“.
Everyone was looking for a weaker open on Monday but that’s to be expected the way the indices closed last week. This sentiment is likely what set up strength early this week. The markets were technically oversold and a counter-trend rally was certainly in line. Having said that, this is probably not the time to go short or aggressively long. Caution is warranted on either side.
This week is focused on Wednesday and around the FOMC when it comes to Economic Reports. We had the Consumer Price Index and Empire State Mfg Survey on Tuesday. On Wednesday we have Housing Starts, Industrial Production, PMI Manufacturing Index Flash and EIA Petroleum Status Report, which has been of great importance of late with crude plummeting. And then we have the Federal Reserve (FOMC) Meeting Announcement, FOMC Forecasts and Fed Chair Press Conference. On Thursday, Leading Indicators and Philadelphia Fed Business Outlook Survey while on Friday PMI Services Flash. Jeffery Lacker talks as well.
Other main events on Friday are:
- Quadruple Witching
- $SPY goes Ex-Dividend
- Indices Re-balancing (view schedule)
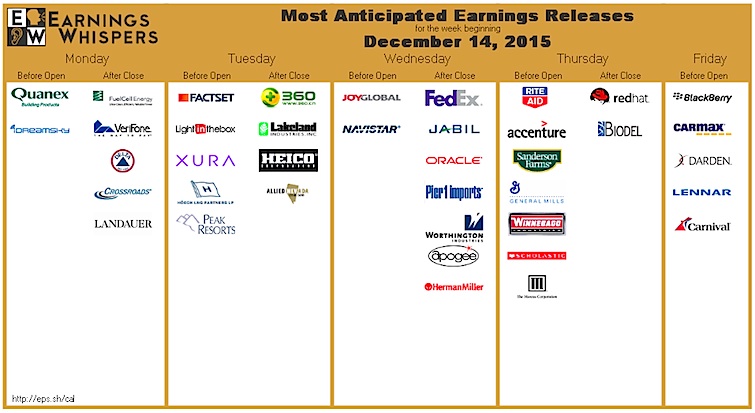
From an Earnings Report standpoint (provided via Earnings Whispers – @eWhispers), there are quite a few strong names reporting. Some of the interesting ones are:
Tuesday: $FDS
Wednesday: $FDX $ORCL $JBL $JOY
Thursday: $GIS $ACN $RAD $RHT
Friday: $DRI $LEN $BBRY $KMX $CCL
Alright, let’s take a look at stock market breadth and some important breadth indicators.
BREADTH INDICATORS:
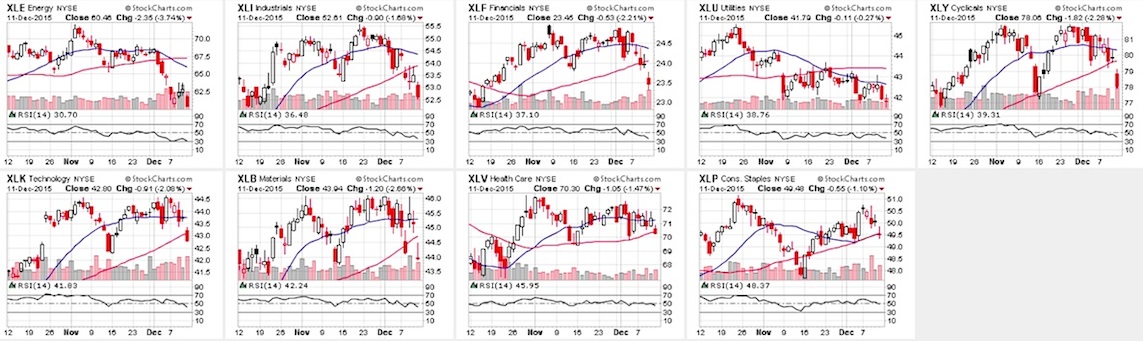
SECTOR PERFORMANCE: CANDLESTICK GLANCE:
Also, here’s the view of S&P sectors with respect to RSI (through last week). The Energy Sector (XLE) is near oversold and many are below median and getting there.
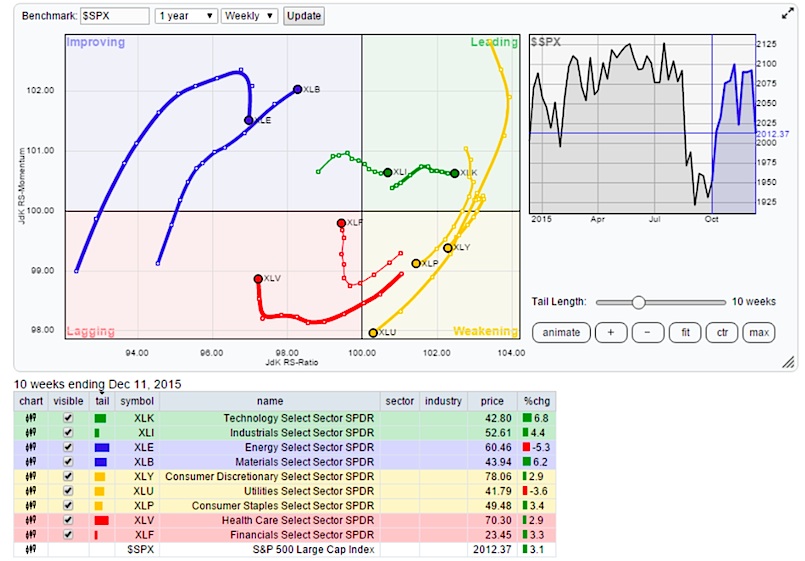
The Relative Rotation Graph (RRG) chart showing the leaders and the laggards among the 9 sectors.
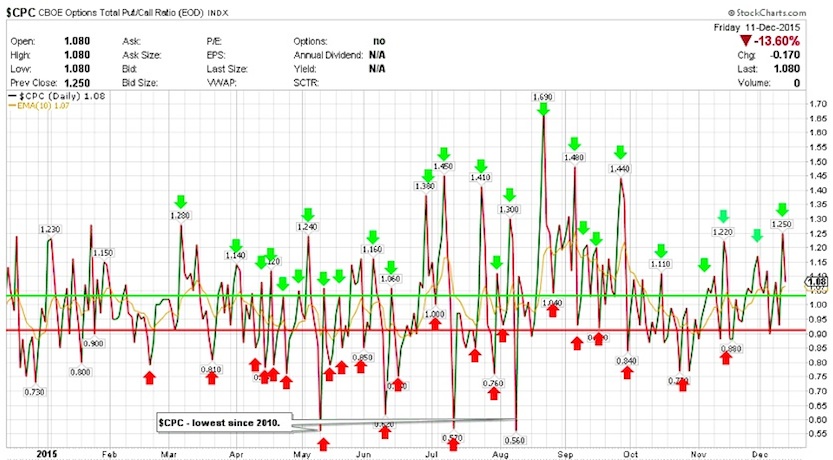
Put-Call Ratio: $CPC
The CBOE Options Total Put/Call Ratio – $CPC finished last week at 1.08 after an intraday pop towards 1.34 on Thursday. The Equity-only put-call ratios remain bearish. The intensity of put buying increased during the week and the rise of these ratios are at a much faster rate. The 10 and 21 MAs are rising as well. While there is a little more room, it doesn’t like to stay elevated for to long and that probably bodes well over the shorter term (hence the early week rally).
continue reading on the next page…

: Showing Some Signs of Emerging Strength")
