It’s been a roller coaster over the past week but that’s expected when the major stock market indices are moving without a trend. It’s probably a good idea to be careful here.
I did mention in last week’s market recap that more consolidation is possible and that this theme was likely to continue for another week at the very least and perhaps until the end of the year. While I did not expect such a big drop and a snap back, these gyrations were expected.
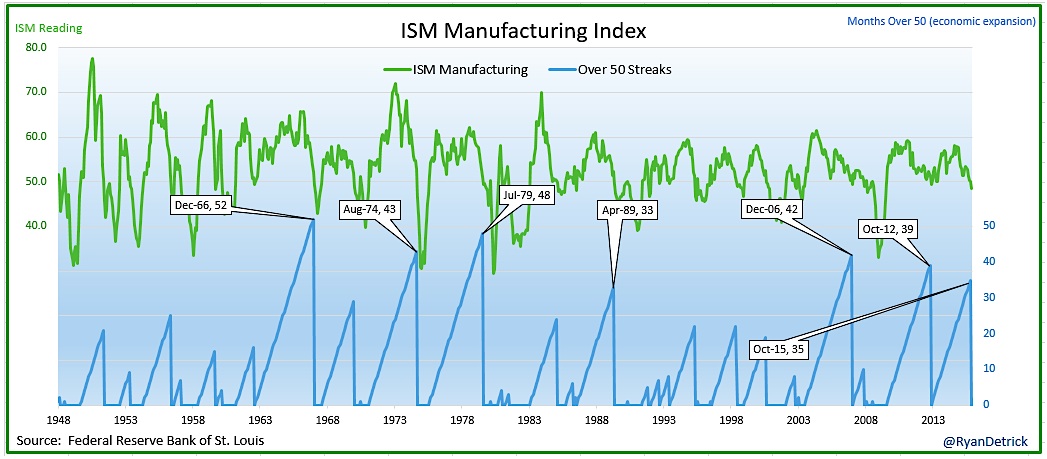
There were tons of Economic Reports on the calendar last week, Fed speakers aboard and the ECB rate decision. Some of these economic reports were very disappointing. ISM Manufacturing dropped below 50, Chicago PMI drop to 48.9 and so on.
From Ryan Detrick (@RyanDetrick): ISM manufacturing <50 for first time in 35 months, one of longest streaks ever. Some streaks ended near recessions.
The main theme – this is a consolidation phase building energy underneath the surface for an explosive move one way or the other in stocks over the coming weeks. And if you ask me, I see more accumulation overall than distribution where buyers have stepped in and bought nearly every dip in stocks. This is at least so far and I may be wrong. Looking at the weekly charts, I think that the 8 or 10 day simple moving average (sma) is providing buyers opportunity to load up and an area where the institutions are likely loading up. Yes, the range is slightly bigger but this is more about shaking the weaker hands. Overall, if you just look at price action, minus all news and things happening in media etc., this has been constructive action although choppy range. And that is the stock market in 2015 in a nutshell.
The upcoming week is light on Economic Reports. The main ones are Import and Export Prices on Thursday and PPI, Retail Sales and Consumer Sentiment on Friday. One other event (not listed here) is the China related economic reports coming in during the week. James Bullard talks on Monday from a Fed perspective.
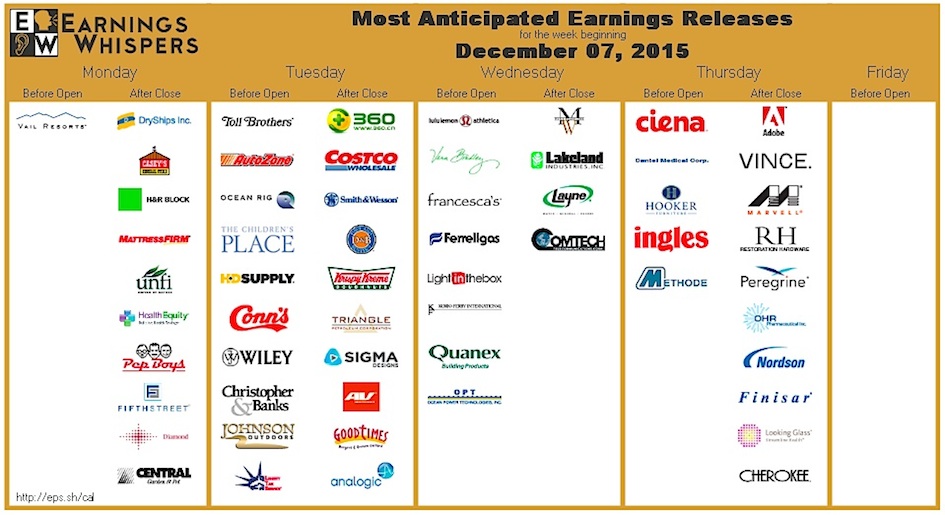
From an Earnings Report stand point (provided via Earnings Whispers – @eWhispers), quite a few strong companies are reporting this week. Some of the more interesting stocks reporting earnings included CostCo (COST) AutoZone (AZO) Toll Brothers (TOL) today, and Lululemon (LULU) and Francesca’s (FRAN) on Wednesday and Ciena Corp (CIEN), Restoration Hardware (RH), Adobe Systems (ADBE), and Marvell Technology (MRVL) on Thursday.
Before I get into the market breadth indicators, a quick note/thought on the upcoming FOMC meeting and possible reactions.
The Federal Reserve is set to meet on December 16th. All eyes are on that. While I am not a proponent or a predictor, here are some potential moves based on what I see.
- More stock market chop – just like how we have in the entire year of 2015 till the end of the year. Basically continue to be trendless (2020-2135).
- Market seasonality – the next week or two are supposed to be soft or even bearish. Perhaps sideways to lower into FOMC and then rip higher into the end of the year. This certainly would be the best case scenario for stocks if you are looking for a Santa rally.
- Stocks continue higher, breakout over 2135 and go up to say 2150 prior to FOMC and the reaction to the FOMC news is drop like a rock.
Again these are just various possibilities to keep in mind. And don’t forget to keep an eye on the German DAX stock market. It is very important that the Euro zone doesn’t drop much more.
Alright, let’s delve into some stock market breadth indicators.
Market Breadth Indicators
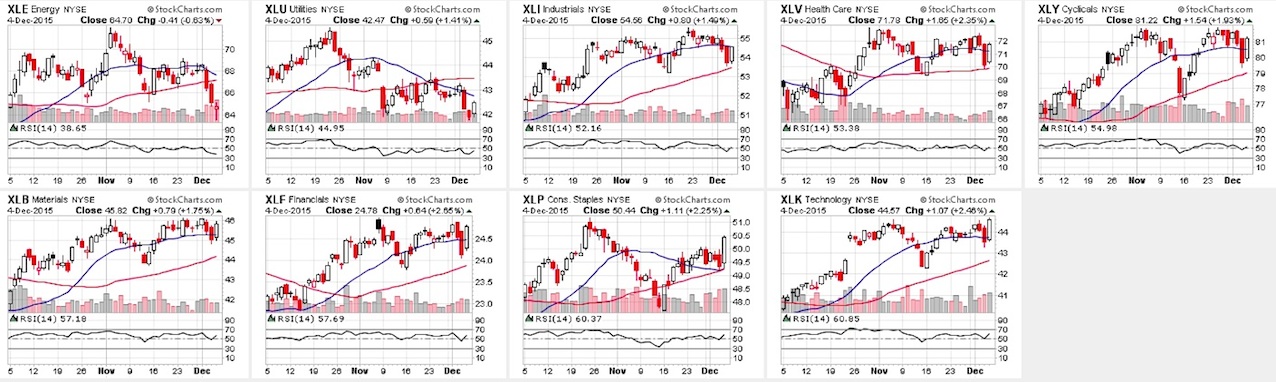
Sector Performance At A Glance:
Here’s a view of S&P 500 sectors with respect to their Relative Strength Index (RSI). None of the market sectors are overbought or oversold yet from a longer term perspective.
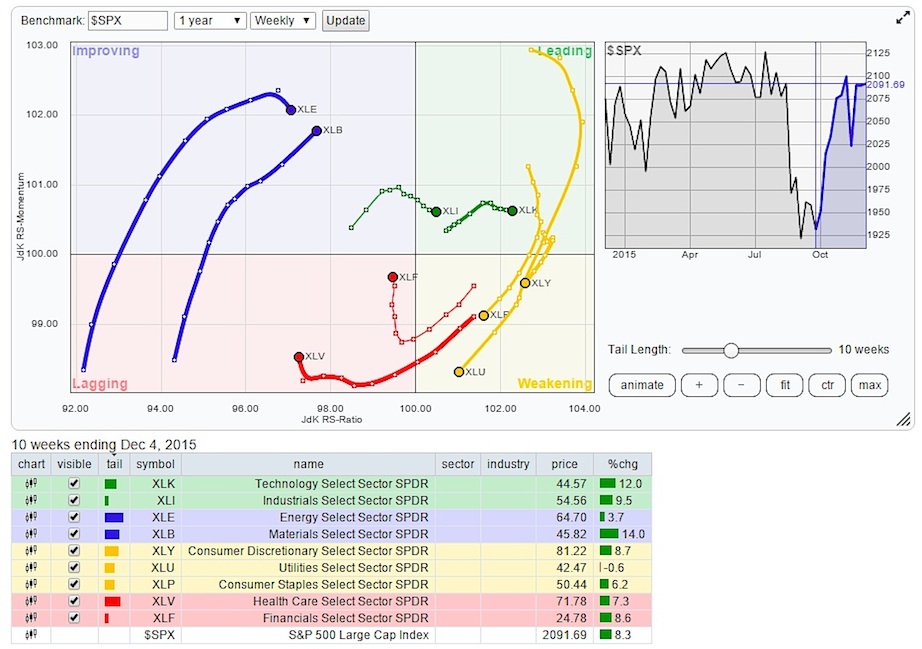
The Relative Rotation Graph (RRG) chart showing the leaders and the laggards among the 9 market sectors.
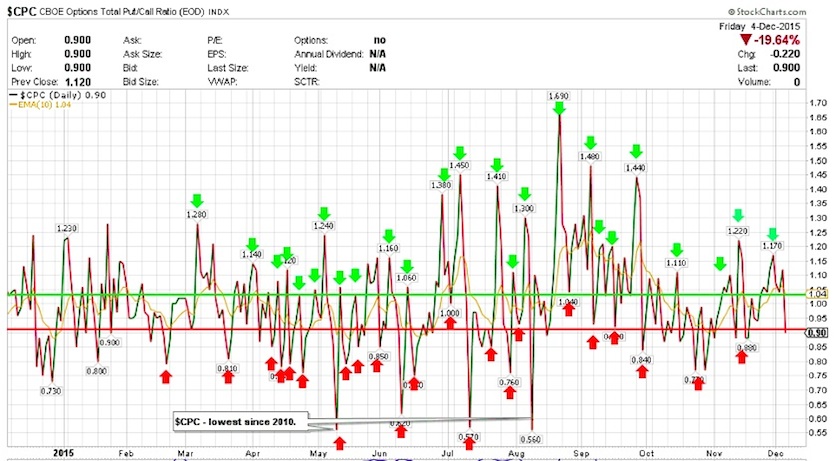
$CPC – Put/Call Ratio:
The CBOE Options Total Put/Call Ratio ($CPC) finished last week at 0.90. Back in that range that I had mentioned 2 weeks ago after intra-week pop.
continue reading on the next page…


