The Equity only put call ratio ($CPCE) (not shown) rose to 0.90 on Thursday before rolling over towards 0.61 by the end of the week on Friday.
Lower is better for equities — but if the 21 day moving average turns higher, expect more rangebound action and volatility spikes.
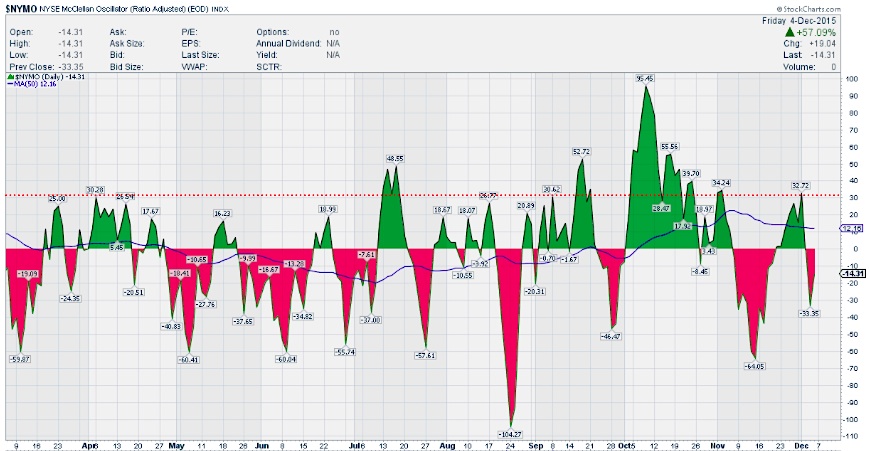
$NYMO (McClellan Oscillator):
The McClellan Oscillator $NYMO finished the week negative at -14.31 even with Friday’s snap back rally. Moving over the zero line would be bullish. $NYSI too has crossed lower and falling. Not a great looking combo here, at least yet.
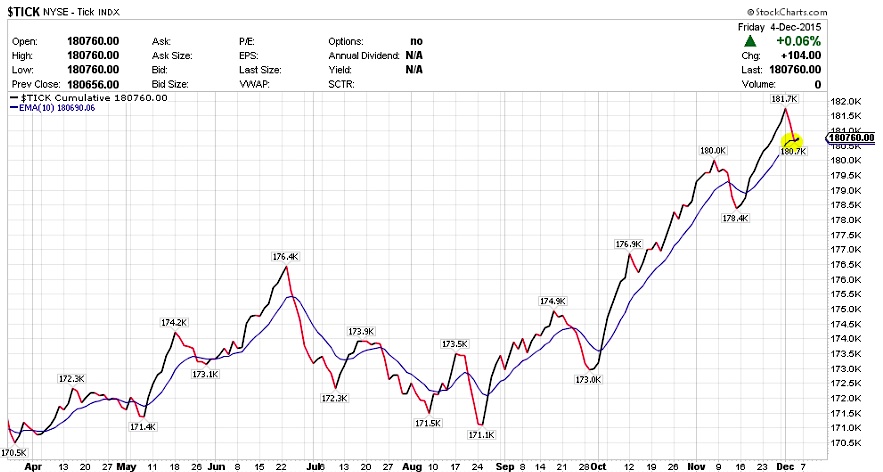
TRIN & TICK Indicators:
While $TRIN finished the day at 0.94, it had minor spikes during the entire week, probably because of higher volume and breadth was not that great during the entire week up until Friday when it turned around a bit.
$TICK line has crossed below the 10 EMA, sort of a negative move but not falling yet. Need to see if we continue to get some positive ticks Monday and Tuesday so that this cross up again.
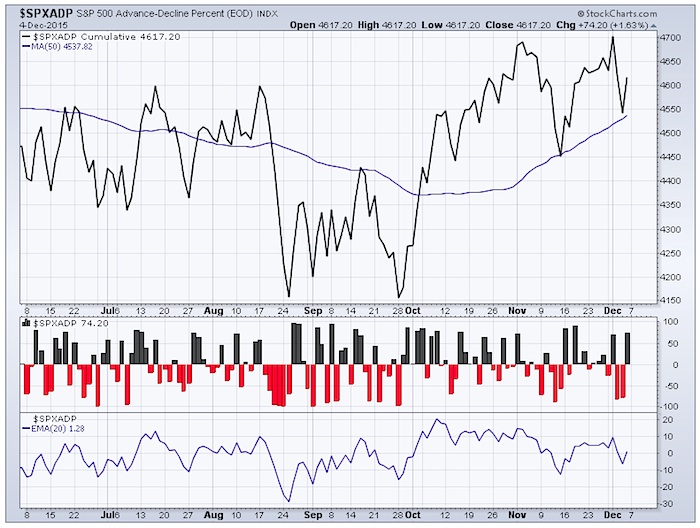
Advance-Decline Percent Data – $SPXADP
The Triple view of the Advance Decline data for $SPX. After making a new high, the S&P 500 Advance-Decline Percent dropped lower towards the 50 MA and bounced. So far looking good and as long as it holds above the 50 MA, it maintains a bullish posture.
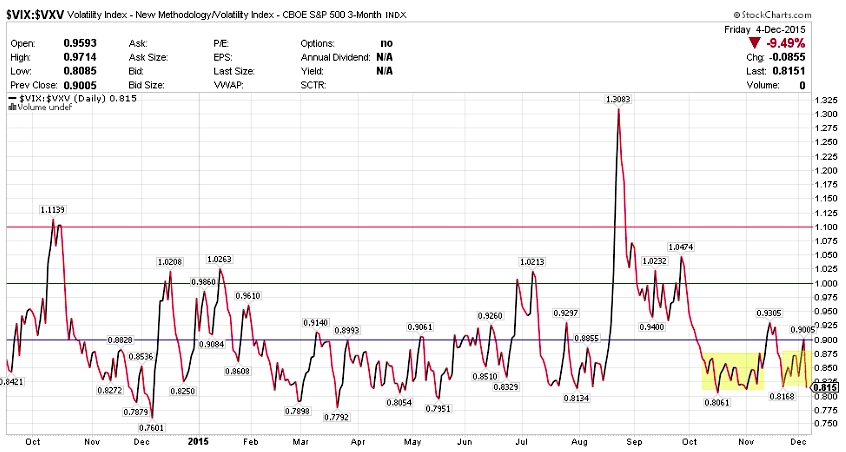
Volatility Term Structure – $VIX:$VXV
$VXV is the 3 month volatility index. The relationship between $VXV and $VIX (30 day volatility) or the ratio between them if > 1.00 often spells trouble for stocks. After a bounce towards 0.90, it touched back down near the 0.815 level to end the week. As long as this stays below 1.00, there isn’t too much to worry about. But I will be watching to see if this falls further or bounces again.
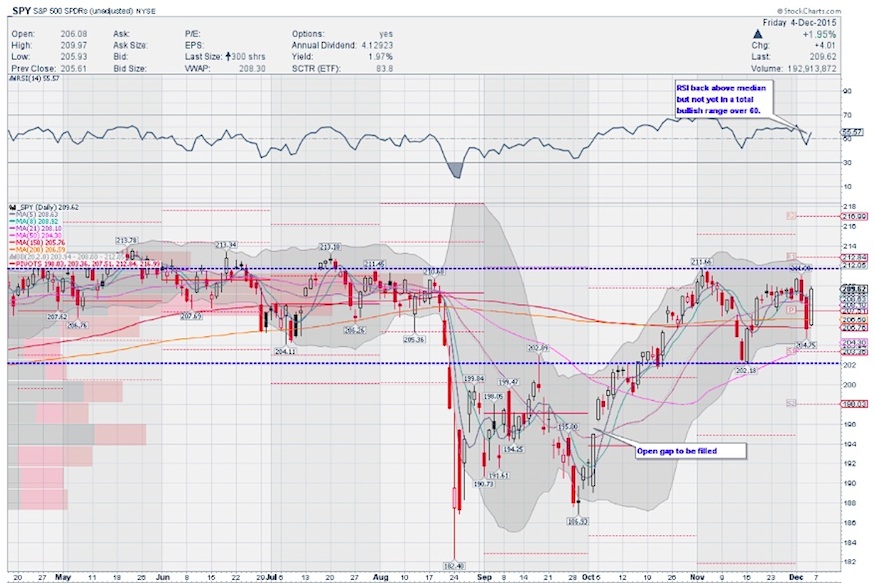
S&P 500 ($SPY) Daily Timeframe:
On Friday, with the jobs number, the S&P 500 ETF (SPY) gapped higher and finished the week right near where it closed out the prior week. During this move, SPY made another higher low. A lot of opportunities on both sides if you were not stuck on one side of the tape.
As far as momentum indicators go, RSI is back above median and a tad below the 60 mark. Still in bullish territory. However MACD that crossed lower earlier, needs to turn and make a bullish cross. Slow STO is working off overbought market conditions and is falling towards the median. Overall a mixed bag here for stocks. More consolidation or rangebound action is possible.
S&P 500 ETF (SPY) – Daily Chart
You can read more of my weekly analysis on my website. Thanks for reading and have a great week.
Twitter: @sssvenky
The author has a position in S&P 500 related securities. Any opinions expressed herein are solely those of the author, and do not in any way represent the views or opinions of any other person or entity.


