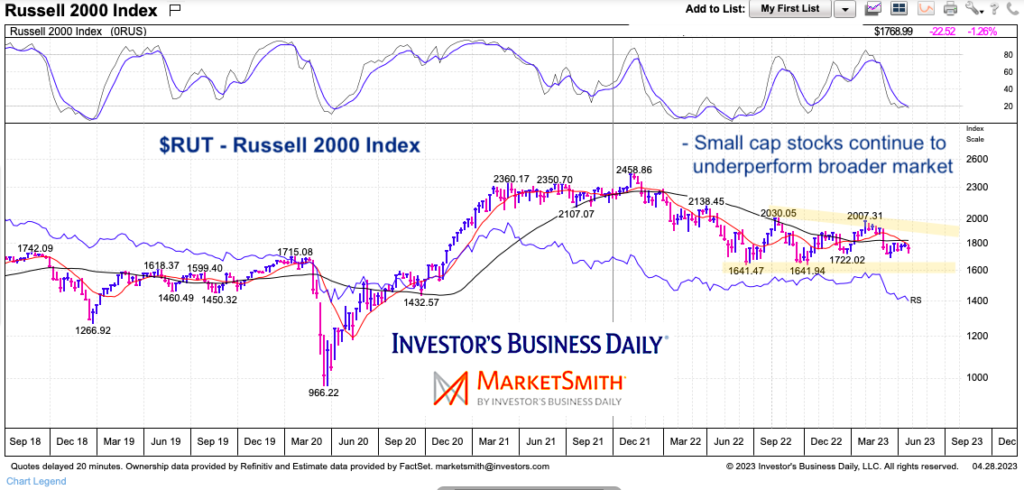
While the S&P 500 and Nasdaq 100 Indices have currently recovered nearly 50 percent of losses, the Russell 2000 Index has recovered just 15% (at current levels).
To be fair, late last year the small cap Russell 2000 Index was trading at levels that had recovered 47% of its losses. So what happened?
Classic underperformance.
As the Russell 2000 chopped sideways to lower, the S&P 500 and Nasdaq 100 traded higher. Today we share a simple chart to illustrate just how ugly the price action has been on the Russell 2000 this year. It’s definitely been a thorn in the bulls side!
Note that the following MarketSmith charts are built with Investors Business Daily’s product suite.
I am an Investors Business Daily (IBD) partner and promote the use of their products. The entire platform offers a good mix of tools, education, and technical and fundamental data.
$RUT Russell 2000 Index “weekly” Stock Chart
Below you can see the initial rally to 2030. But from there it has been sideways to lower. At 1768, the Russell 2000 is just 8 percent off its lows. Price appears to be narrowing a bit with lower highs but a clear support at 1640. If the market slides from here, it will be important to keep an eye on that price support.

Twitter: @andrewnyquist
The author may have a position in mentioned securities at the time of publication. Any opinions expressed herein are solely those of the author, and do not in any way represent the views or opinions of any other person or entity.


