With financial markets acting all kinds of crazy volatile lately, I thought it would be good timing to revisit a ‘once upon a time’ market leader.
The Semiconductors.
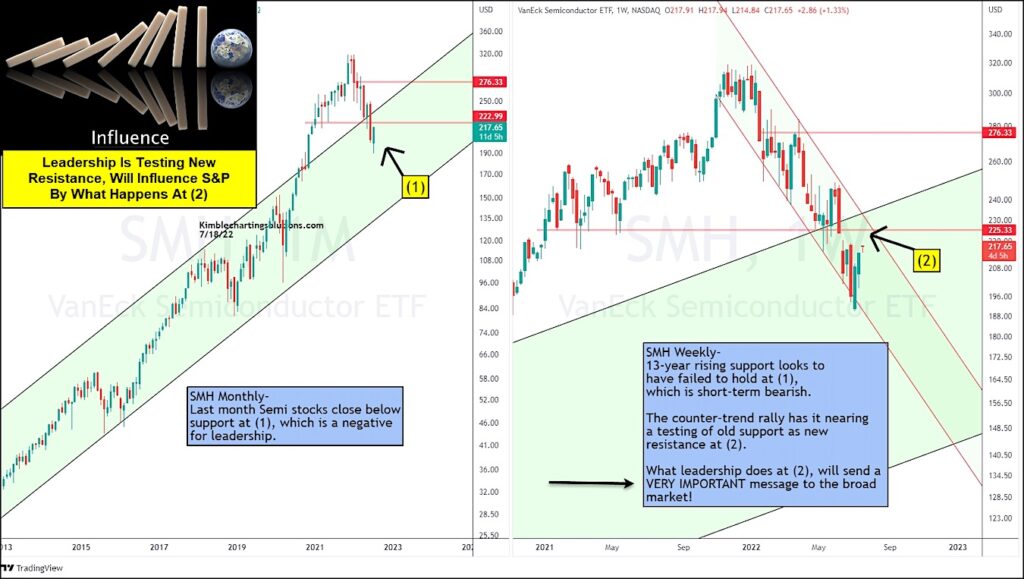
Today’s chart 2-pack provides a look at the Semiconductors ETF (SMH) on a “weekly” and “monthly” time frame.
We highlighted the Semiconductors several times during the bear market. As you can see below, this market leader broke below 15-month price support at (1) and it is now nearing the underside of it at (2).
If the Semis cannot recover this level, it will likely lead to more sideways to lower price movement.
This is a BIG test of “new resistance” for this market leader. What happens next will likely impact the broader market. Stay tuned!
Semiconductors ETF (SMH) “weekly” & “monthly” Chart
Note that KimbleCharting is offering a 2 week Free trial to See It Market readers. Just send me an email to services@kimblechartingsolutions.com for details to get set up.
Twitter: @KimbleCharting
Any opinions expressed herein are solely those of the author, and do not in any way represent the views or opinions of any other person or entity.


