In early February I provided subscribers with a sector update, highlighting Health Care (NYSEARCA:XLV), Energy (NYSEARCA:XLE) and Utilities (NYSEARCA:XLU).
I’d like to revisit those thoughts and what’s happened since.
Here is what I wrote about Health Care (XLV):
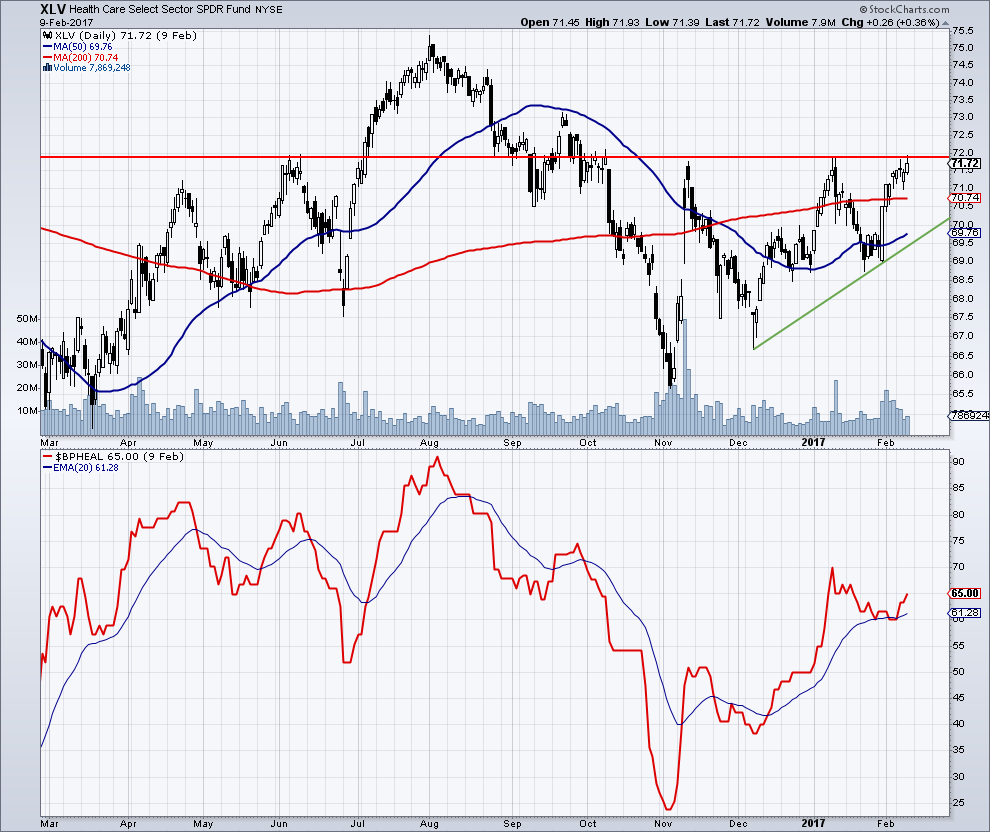
The Health Care ETF (XLV) currently looks like it has potential as price is pushing up against chart resistance in the 72 area. XLV is bullishly above both its 50-day and 200-day average. There has been two consecutive higher lows and the chart looks like a bullish ascending triangle. The BPI for healthcare is in an uptrend and recently tested and bounced off the 20-day exponential average, a bullish sign. On a break above 72, I think XLV could easily run up to major chart resistance in the 75/76 zone which was the peak in both 2015 and 2016.
And here is the chart.
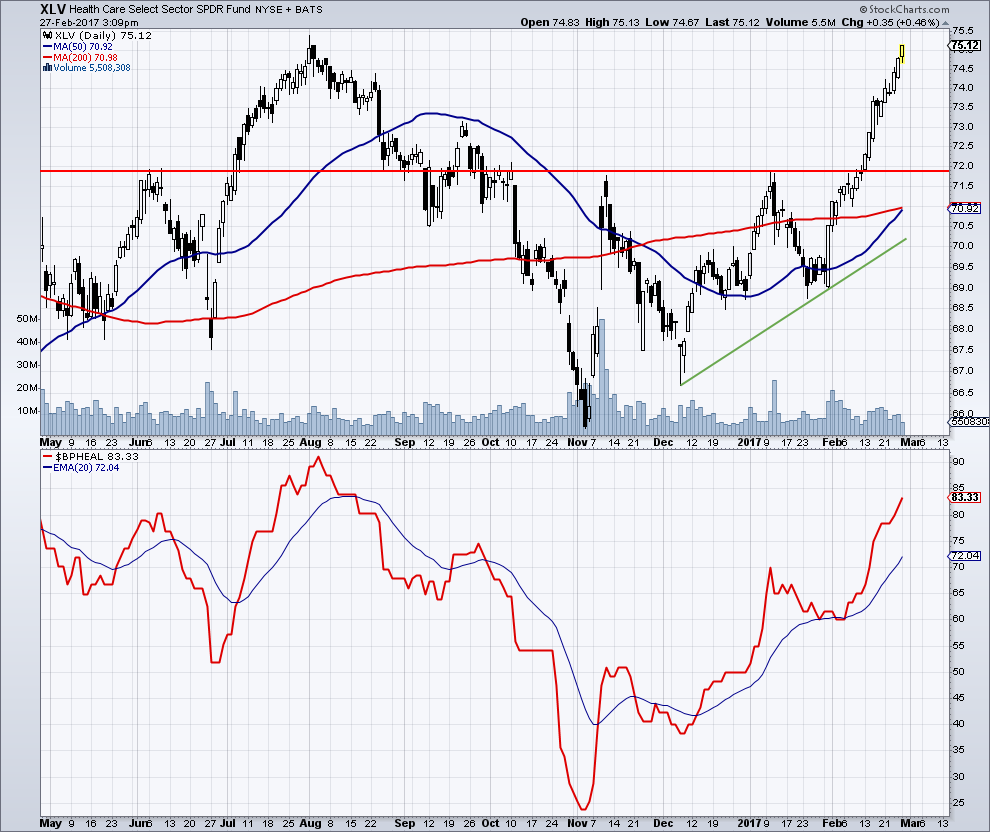
Here is the updated chart with XLV (through 2/27) moving into my target range of 75/76.
Here is what I wrote about the Energy Sector (NYSEARCA:XLE)
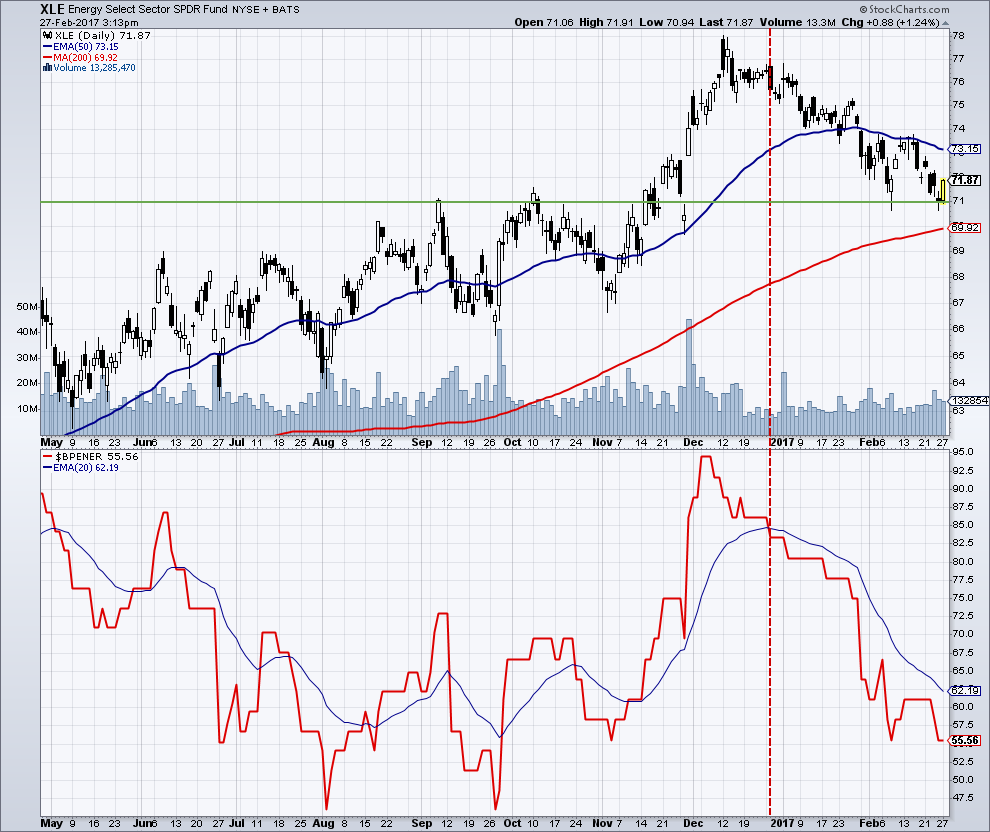
The first sector I will look at is energy (XLE). Look how overbought the BPI got in early December with a reading of 94.5%, meaning that almost every energy stock in the XLE was on a P&F buy signal. BPI then broke below it’s 20-day exponential in late December, preceding a fair amount of weakness in the XLE.
XLE has found support at the top of its 2016 range and bounced. If XLE can hold these lows, trace out a bottoming formation, and see the BPI cross back above its 20-day exponential, that would be a bullish sign.
Updated chart (2/27) & analysis: XLE is attempting to trace out a bottoming formation – double bottom at the 71 area. To complete this bottom, XLE needs a close over the intervening high at 73.76. In addition, I would like to see the BPI (lower panel) jump back above its 20-day exponential average. No trade yet, still developing.
Here is what I wrote about Utilities (XLU):
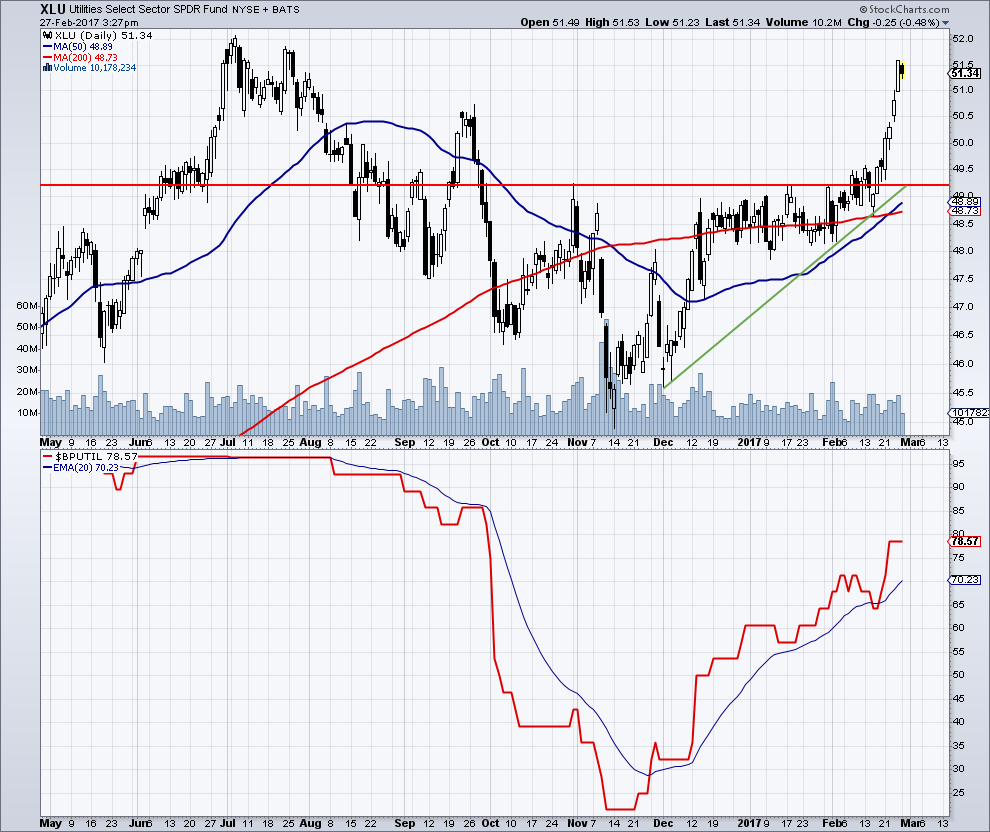
The utility (XLU) sector continues to tease us on the upside. That is, it continues to flirt with a breakout of the 49.20 zone and keeps getting rejected. Like the XLV chart, price is working on a potential ascending triangle pattern, which is a bullish formation. The BPI, which got pretty oversold in November down in the 22% region, has been in an uptrend ever since. This is an interest rate trading vehicle. If rates go lower, XLU goes higher, and vice versa. If XLU breaks down, it might be a good tell that my long treasury trade should be changed to the short side.
Updated chart (2/27) & analysis: Finally broke out, but right at key resistance from last summer.
Thanks for reading. Reach out to me at arbetermark@gmail.com for inquiries about my newsletter “On The Mark”, if interested.
Twitter: @MarkArbeter
The author is short crude oil via SCO at the time of publication. Any opinions expressed herein are solely those of the author, and do not in any way represent the views or opinions of any other person or entity.

: Showing Some Signs of Emerging Strength")

