Interesting mathematics are at play inside the Small Caps stock charts across several time frames with the Russell 2000 Index (INDEXRUSSELL: RUT) and iShares Russell 2000 Index Fund (NYSEARCA: IWM).
And it could spell trouble for small caps bulls… and point to a Russell 2000 top.
Let’s review the charts in terms of time and price.
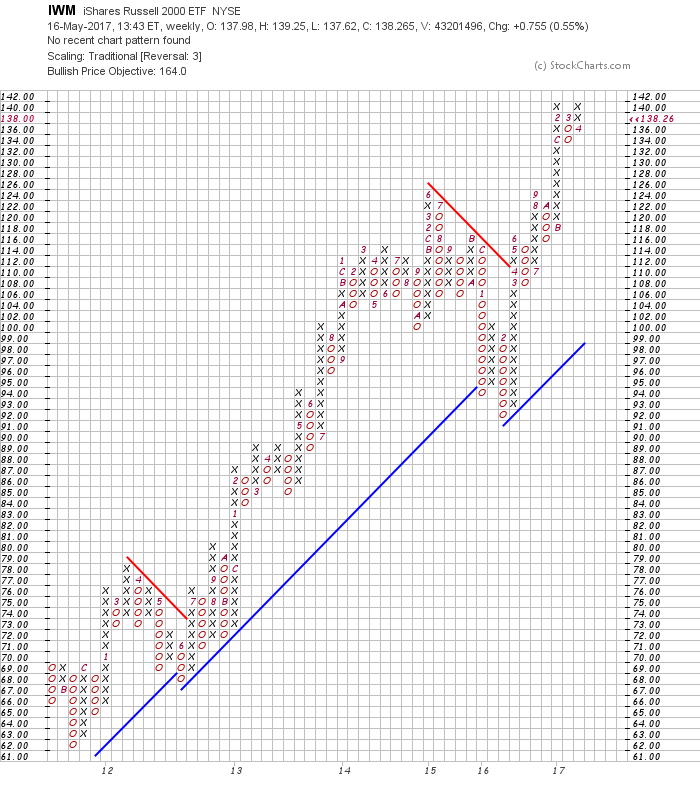
Here are the last 3 intermediate term correction lows. The idea here is to see if the 170 level for IWM was or isan intermediate term top; or the top for a while. The IWM ETF has met the target price objective we shared May 16, 2017. Going from $138.26 to the objective of $164.
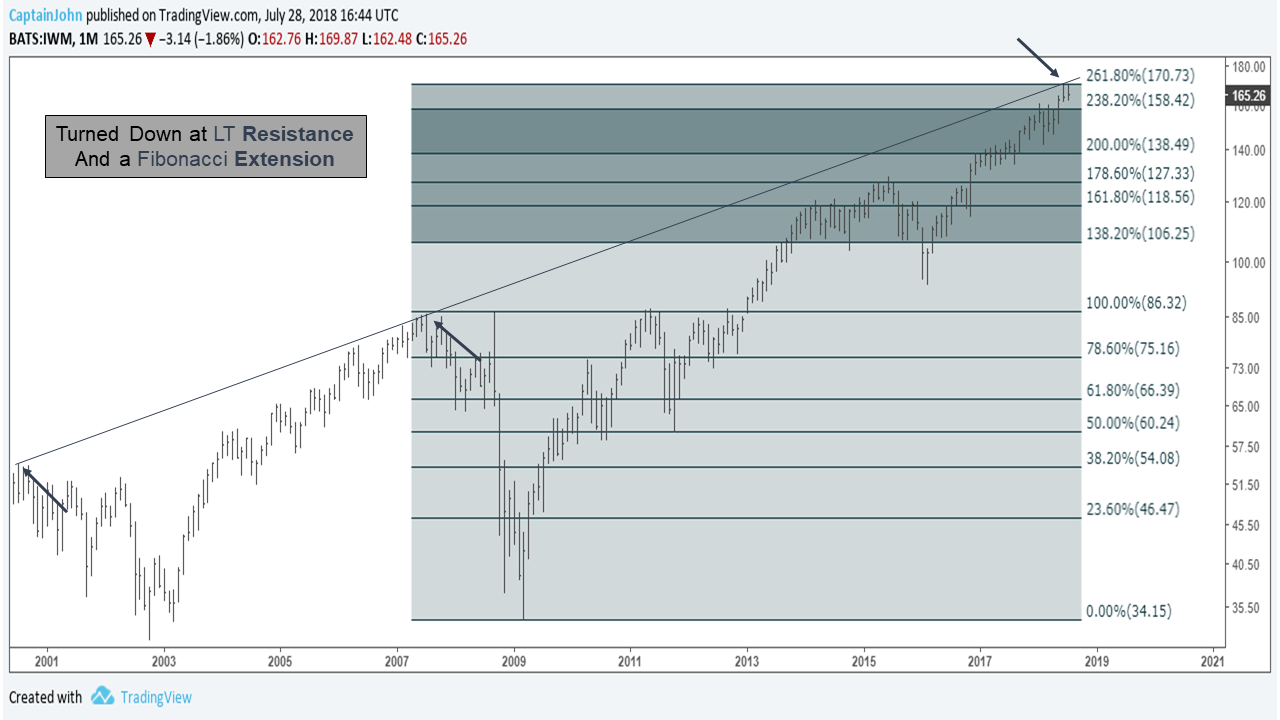
On July 28th at a close of $165.26 price turned down at a long term resistance (2001) that fell precisely on the 261.80% Fibonacci extension. This extension acts also as long term resistance lines; being strong resistance but more importantly as a flag that a temporary top may be in.
At this stage, an assets price has gone well past perfect harmony of 1.618%. At this stage, price typically turns down and buyers start drying up. In this example of the Monthly stock chart of $IWM, price rejected both.
The 261.80% is also a turning point moment to be on watch for if your riding on the mountain of profits racked up since the 2009 low.
The long term resistance and fibonacci are fantastic for giving you that heads up but wouldn’t your rather drill down deeper into pinpointing even closer WHEN you’ll get a high or a low?
The better your entry and exit the more profit’s you keep! The better your drawdown ratio gets, the more you’ll compound.
What if I told you that 2 Interim Lows forecasted the Price and the Date back in September of 2017, long before you could have imagined where the IWM small caps would be a year later?
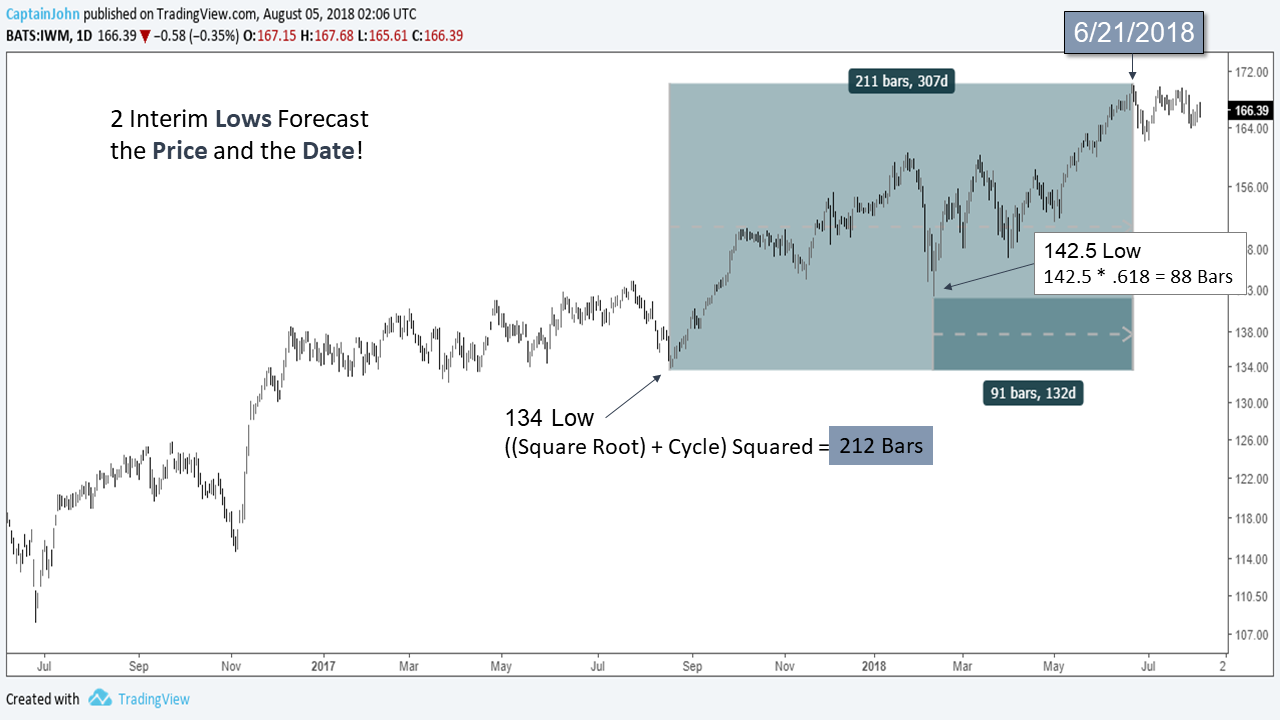
Let us begin at the 1st low at 142.5.
The square root of 142.5 is 11.93. If you add 1 to 11.93 the sum is 12.93. Now square the sum,12.93. That equals ~167.
$167 was the Price at the high as of June 21 2018 and again in July when price tested that area for the second time!
The 2nd Low looking back to August of 2017 is $134.
Let’s use the golden ratio for some calculations.
0.236 is the number you get when you take 0.618 and cube it or (.618 x .618 x .618) The sum is .236.
Add .236 + 1 = 1.236.
1.236 x $134 PRICE LOW= ~165!
3rd low looking back is 115.
50% or one half of 115 is 57.5.
Add 57.5 +115 = 172.5.
The importance of 167, 165 and 172.5 reveal the vicinity of the 170 target shown in the July 28th, 2018 chart above.
p.s. Squaring a whole number like the number 13 gives you = 169.
Squaring a whole number is equally as important because that is precisely where turning point’s show up!
Turning points can be a surprise at the time they occur, but that’s why reading the patterns in stock charts can make that turning point, a profit point!
By actively managing at a time of a turning point brings up another subject. Time. Wouldn’t you like to have a rough time frame that gives you a likely month or day of the turning point?
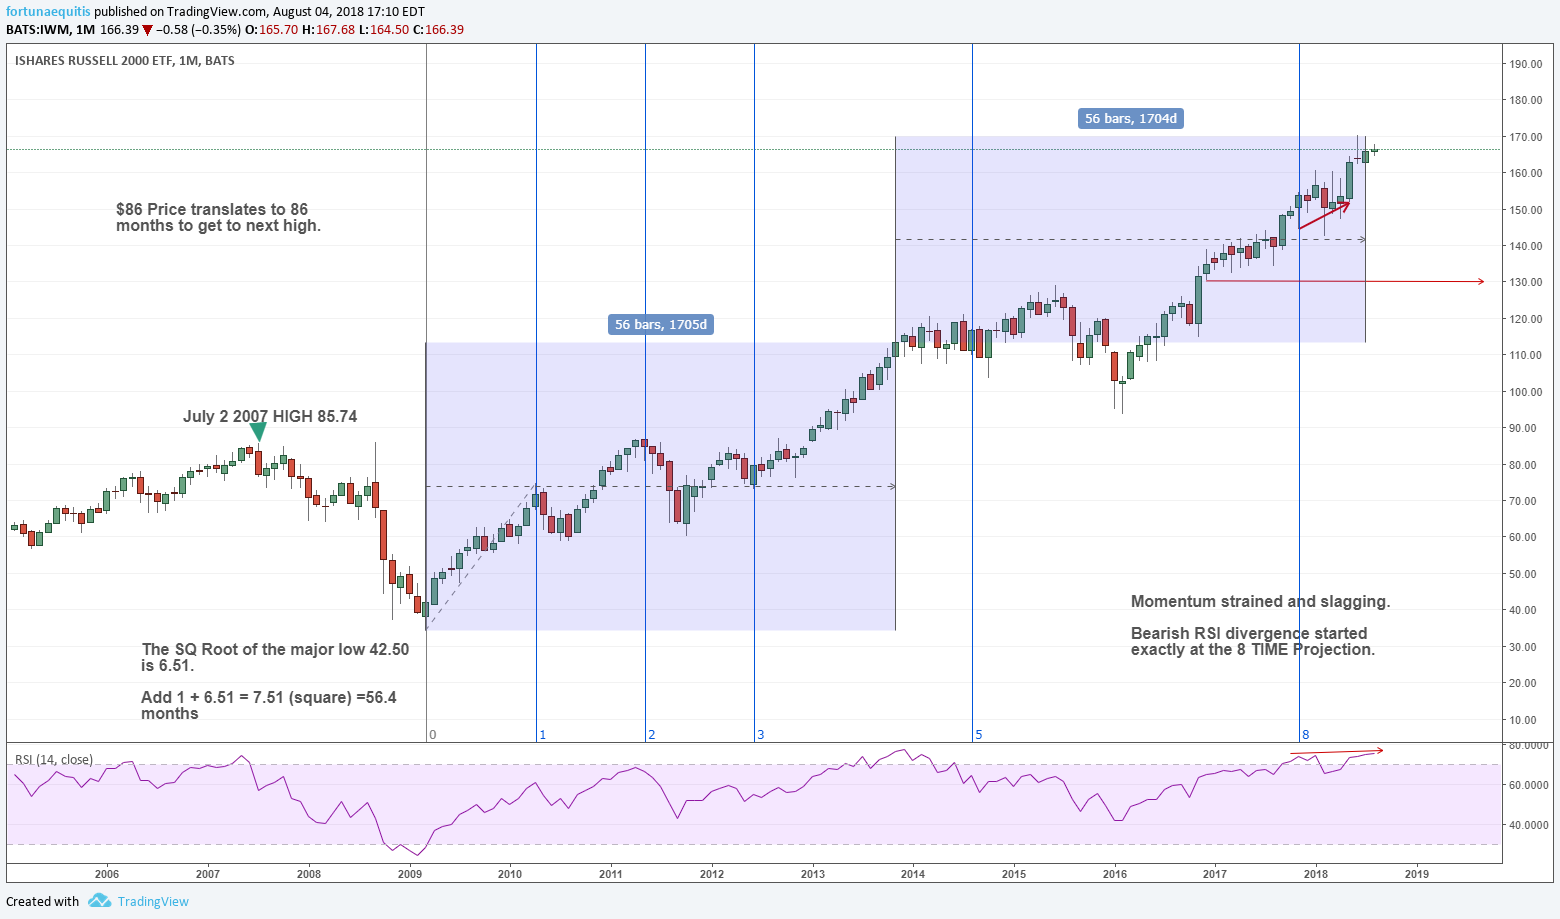
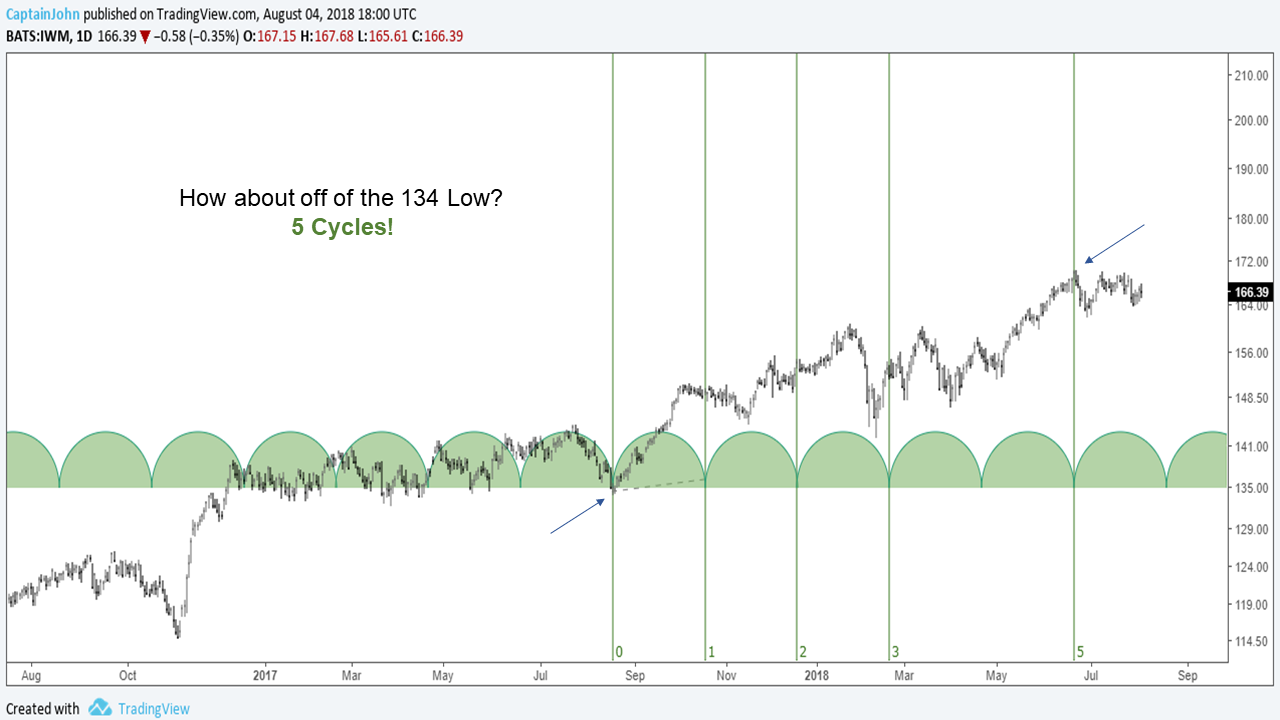
The 8s and 5’s Have It!
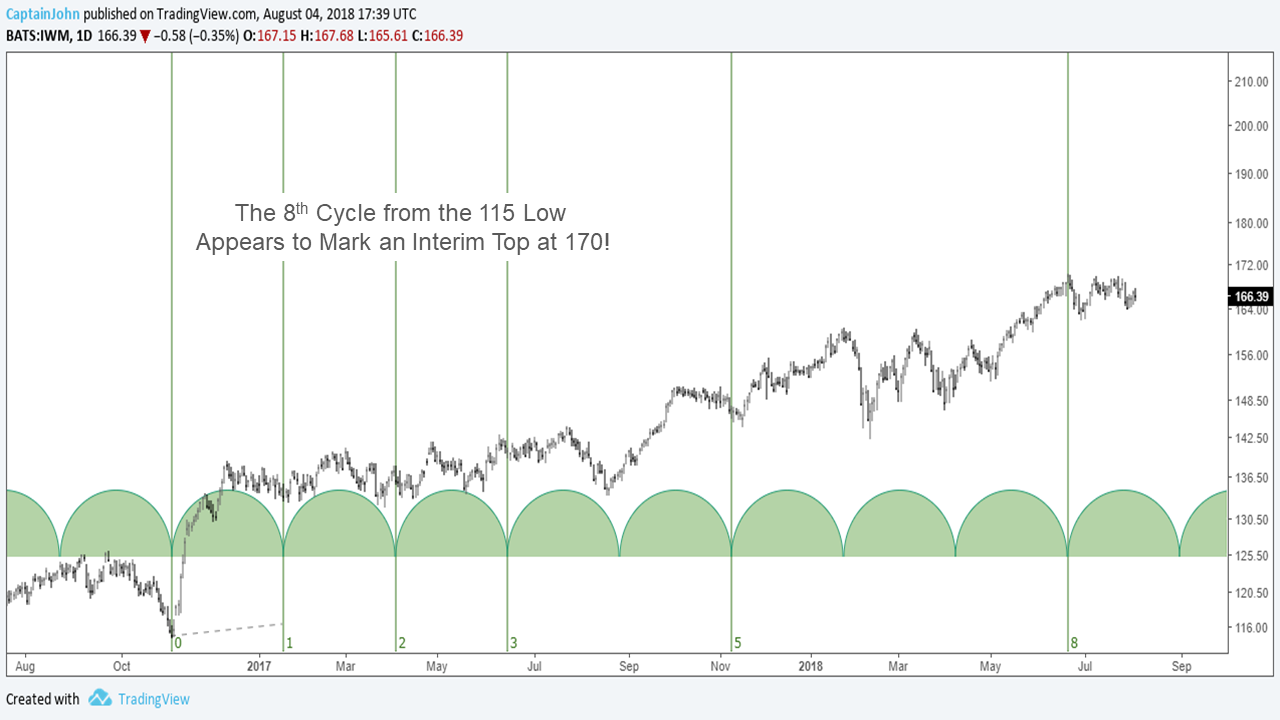
The 5’s: If we consider 5 cycles off the September 2017 low at 134, the fifth cycle lines up exactly at the top on June 21, 2018.
“Time grabs you by the wrist, directs you where to go
So make the best of this test, and don’t ask why
It’s not a question, but a lesson learned in time
It’s something unpredictable, but in the end it’s right
I hope you had the time of your life.”
-Green Day-
Twitter: @CptJohnCharts & @FortunaEquitis
The author may have a position in mentioned securities at the time of publication. Any opinions expressed herein are solely those of the author, and do not in any way represent the views or opinions of any other person or entity.


: Showing Some Signs of Emerging Strength")
