With our last post about the Russell 2000 Index in early December, we suggested that the index was setting up for a much bigger decline into 2016.
In short, the Russell 2000 Index looked ready to fall out of what we were treating as an upward corrective move into resistance. Since that time, the market has played out according to the bears’ plan, staging a steep decline. But there’s likely more to come from this bearish setup.
In this update, we’ll identify some of the price targets and levels to watch for the next stages of the bear market roadmap
The chart below shows weekly candles for the iShares Russell 2000 Index ETF (symbol IWM). Although we have labeled the waves at a fairly detailed level, the most important structure to watch for now is the series of moves counting down from the mid-2015 high and labeled as [i]-[ii]-[iii]. In early December, we were watching the ETF as it approached resistance near 120.62 – the area we were treating as the likely end of wave [ii]. We expected price to begin declining in wave [iii], as it now seems to be doing.
Russell 2000 Index ETF (IWM) – Weekly Chart
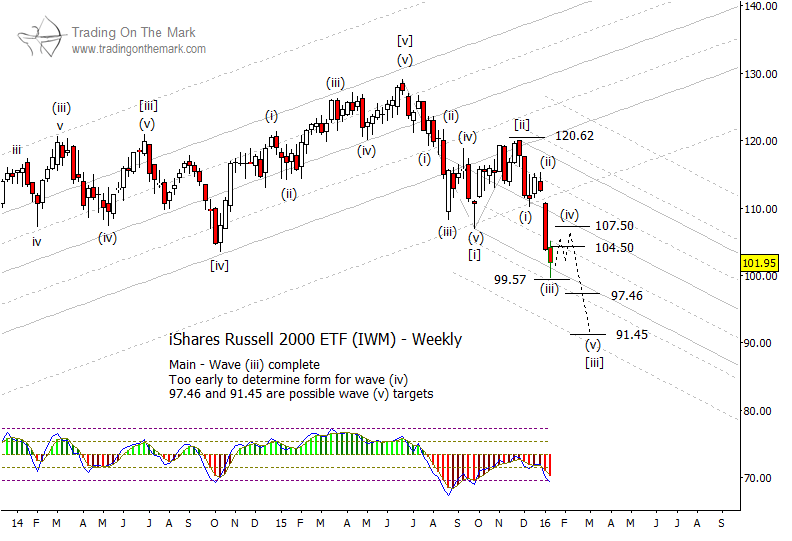
For any trader who found a good entry to short the Russell 2000 index via future contract, ETF, or options, the chart suggests staying in the position until the current downward wave [iii] is more mature. The internal structure of wave [iii] should consist of five smaller sub-waves, and only three of them have printed so far. In coming weeks, we might see price bounce up to test near the resistance areas of 104.50 or 107.50 in small wave (iv), but the form suggests that price should resume its decline fairly quickly.
Important support levels that represent general price targets for wave [iii] are near 97.46 and 91.45. Traders who are already in some type of short position might consider scaling out of their trade as the Russell 2000 ETF approaches one or both of those levels.
Another implication of the chart is that any potentially bullish traders should wait for the downward structure to show signs of completion before attempting any long position. (We would not recommend taking long positions in the Russell 2000 Index unless you are an experienced trader who is very good at using countertrend strategies.)
Readers who think of themselves as investors, rather than traders, should resist the temptation to “buy low” during the next several weeks, and probably for longer. There have been many times since 2009 when “buy the low” was a low-risk strategy, but that no longer appears to be the case.
Our next newsletter will focus on crude oil futures and the Dollar. Request your copy! Thanks for reading.
Twitter: @TradingOnMark
No position in any of the mentioned securities at the time of publication. Any opinions expressed herein are solely those of the author, and do not in any way represent the views or opinions of any other person or entity.


