The Fed and ECB meetings this month make it an important one for financial markets, so we are revisiting our Russell 2000 price forecast and confirming our bearish outlook for U.S. and European stock indices into 2016.
In early October, when we last wrote about the Russell 2000 Index here at See It Market, we used the related iShares Russell 2000 ETF (symbol IWM) to show how price had broken through channel support and how it might bounce to retest that support from below. That scenario appears to be playing out, and price is near the area from which it might begin its next big move lower. A failure here would confirm our bearish Russell 2000 price forecast and begin what could be a lengthy decline.
The Russell 2000, as charted with IWM, offers one of the clearest pictures of a potentially bearish pattern developing on weekly and monthly time frames. The advance since 2011 began showing exhaustion signals early in 2014, and it encountered solid geometric resistance during the early part of 2015. Last spring, price failed to break above the channel we had been watching on monthly charts for some time, and summer saw the Russell 2000 decline away from the upper edge of the channel. That behavior near important big-picture resistance suggests that a top may be in for the index. In fact, many traders in the market may view this autumn’s rally as a developing right shoulder of a head-and-shoulders bearish pattern.
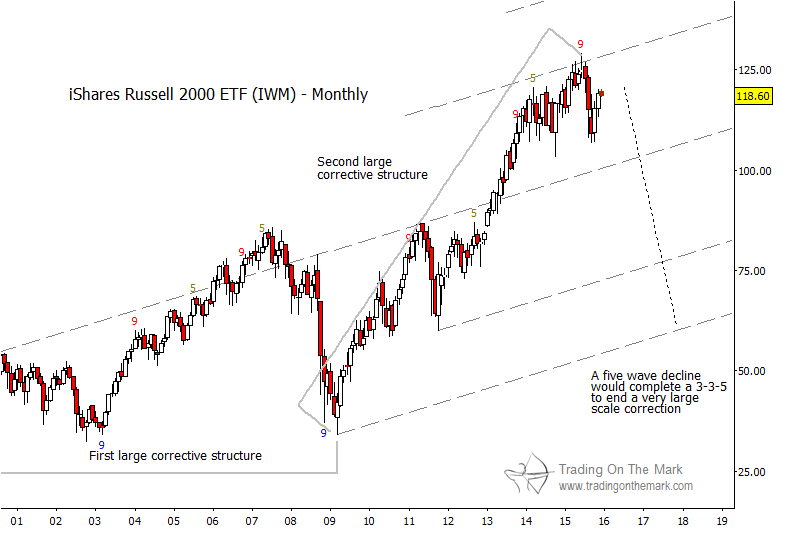
Keeping with the big picture, the Elliott wave structure spanning the last 15 years suggests that the long rally from 2009 to 2015 may have been the middle part of a very large corrective pattern. The long rally can be counted as having three waves, and the preceding years of 2000 to 2009 also can be counted as having three waves. The most common development after two patterns that count as “threes” is would be a five-wave move of similar magnitude. Although it is too early to project targets with much precision, the pattern suggests that a downward move is in store that should be comparable to the size of the 2007-2009 decline, or possibly larger.
Russell 2000 Price Forecast – Monthly Chart
Zooming in with a weekly chart of the Russell 2000, we see that price bounced from the lower channel harmonic, which is the same channel we presented in October. This was slightly higher than the main Fibonacci price targets we had identified, but sometimes geometry takes precedence. The decline into price support counts nicely as a five-wave decline, making it a candidate for a larger impulsive wave [i] of the five-wave sequence we described earlier.
Russell 2000 Price Forecast: Weekly Chart
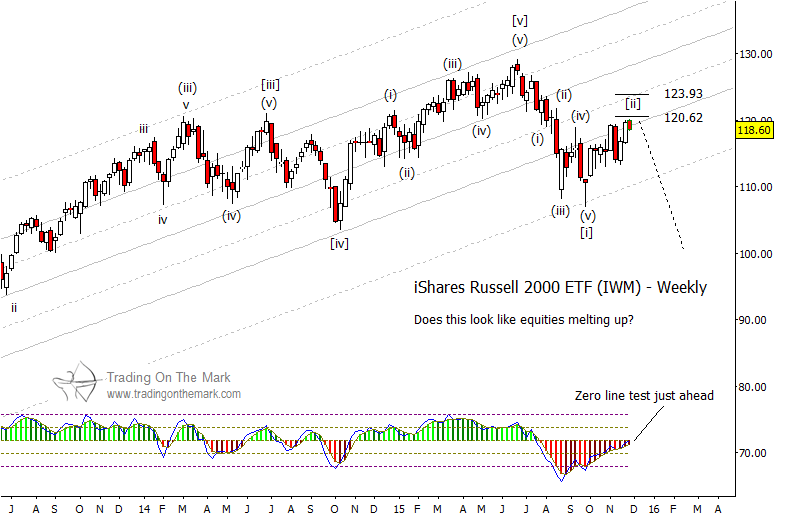
Tracing the pattern upward from the area of the bounce, we note that the Russell 2000 is testing the main element of geometric support that it broke earlier this year. Although recent weeks have printed candles that poke a little bit above the broken channel line, the important Fibonacci resistance levels at 120.52 and 123.93 have not been broken.
continue reading on the next page…


