Last week we posted a chart showing how the S&P 100 Index (OEX) is on track to reach new highs late this year or early in 2020.
Today we look at the Russell 2000 (IWM), an index that has been lagging significantly behind OEX. We show how it might (or might not) catch up.
When we last posted about the iShares Russell 2000 ETF (IWM) it was just beginning its bounce after the scary low of December 2018.
While many traders were looking for downward continuation, we were treating the low as a corrective fourth wave in an upward five-wave pattern.
The stronger rallies in other indices during 2019 show that our early assessment was probably correct, but IWM has been trailing behind its peer indices. While we still believe last December’s low was wave (iv), there are at least two viable scenarios whereby it can attempt to challenge the previous wave (iii) high and maybe exceed it.
Our main Elliott wave scenario treats the sideways action that has occupied most of 2019 as corrective wave ‘ii’ within the larger upward wave (v). In this view, IWM should still have substantial room to run upward going into 2020, possibly reaching for a level that would look approximately like a “double top” formation.
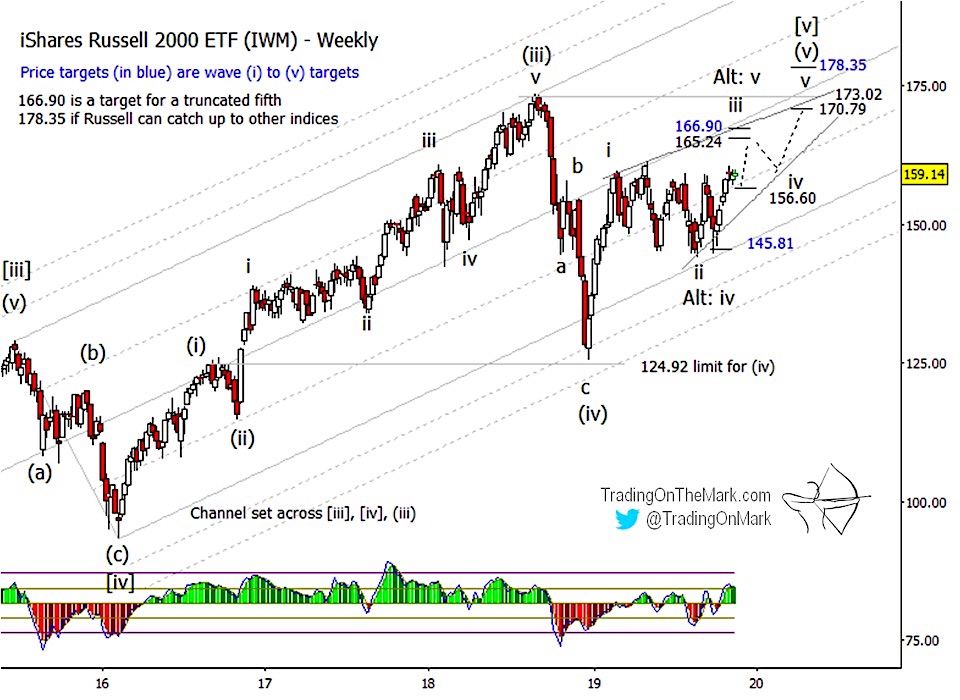
In the main scenario, price is probably trying to rise in middle wave ‘iii’ of (v). A very modest pullback to support near 156.60 could launch it toward the next resistance levels near 165.24 or 166.90 to complete upward wave ‘iii’.
Higher targets in the main scenario at 170.79 and 178.35 sit both below and above the prior wave (iii) high. It’s possible the form of wave (v) could reach completion at the lower level, resulting in a slightly truncated wave (v) of [v] high preceding a major downward reversal. We recommend traders note whether other indices appear to be at inflection points when IWM tests that level.
Like the main scenario, our alternate scenario also treats IWM as climbing toward a high that would precede a major reversal. The difference is a question of how far wave (v) has progressed already.
Readers might recall that last week’s chart of OEX showed how the rally from December 2018 to February 2019 might have represented sub-waves ‘i’, ‘ii’ and ‘iii’ of (v), with the wave ‘ii’ correction being very brief and shallow. If we apply a similar count to IWM, that would suggest the August low might have been wave ‘iv’ in the final upward impulse.
In the alternate scenario, the prospect appears more likely for truncation and a final high that stops beneath last year’s wave (iii) high. For now, we believe the same price targets are relevant, but the alternate scenario would probably have price fall away decisively from the 165.24 or 166.90 area.
For traders who are not trying to catch the actual top, a break of support at 156.60 can serve as initial confirmation of a change in market weather.
It’s easier to find the trades when you start with the right charts. For a limited time this fall, get access to all the charts and lock in a 15% price reduction with the coupon code AUTUMN. Visit Trading On The Mark to see examples of our coverage of the Euro, the Dollar Index, gold, crude oil, bonds and the S&P 500 on weekly, daily and intraday time frames.
Watch for our next post, which will examine how the New York Composite Index might approach a reversal.
Twitter: @TradingOnMark
The authors may have a position in the mentioned securities at the time of publication. Any opinions expressed herein are solely those of the author, and do not in any way represent the views or opinions of any other person or entity.

: Showing Some Signs of Emerging Strength")
