The final quarter of 2018 has confronted investors with the possibility of a long-term bear market, but the damage still might not be fatal to bullish wave counts.
Here we present a scenario that traders might wish to keep beside their desk.
The question is whether the recent decline might represent a deep fourth-wave correction as part of an impulsive upward move from early 2016. That prospect still looks appealing for the Dow Jones Industrial Average, although the decline has been relatively larger in the Russell 2000 (NYSEARCA: IWM).
We’ll be posting charts for both stock market indices this week. Today we look at the Russell 2000.
In all of the major stock indices, a top really would look better with a new high later this year, above the 2018 high. That is based on an expectation that the move up from 2016 should consist of five waves.
With the iShares Russell 2000 ETF chart (shown below), an Elliott wave count up to the 2018 peak fits better with the idea of three waves to that point rather than five. That would leave room for one more push to new heights.
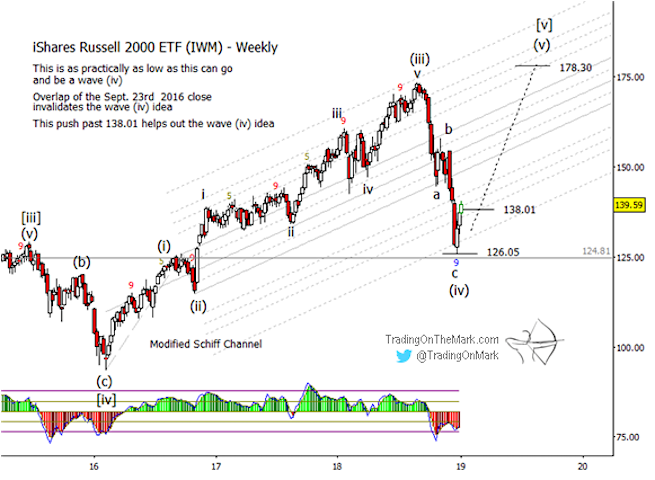
In order for the recent decline to be a fourth wave on the Russell 2000 (IWM), the downward wave (iv) should not have much overlap with the high represented by wave (i) back in September 2016. Specifically we would not want any weekly close at this time to be beneath 126.05. As you can see on the IWM chart, the index bounced strongly from an initial test of that area.
Just as we were watching for a five-wave move up from 2016, we also expected to see a five-wave downward move on a smaller scale from the lower high that IWM printed in early December 2018. Since the recent downward move counts better as three waves rather than five, the case for this scenario would be stronger if IWM were to test the support near 126.05 a second time and then bounce again.
As we mentioned earlier, this is a scenario for traders to keep beside their desks. The prospect of another high this year is far from certain, but this article shows where the major turns and confirmation events could happen if the bullish scenario really does kick in.
If the decline really does turn out to be a fourth wave correction as described here, the first area where a trader might watch for breakout confirmation would be above the resistance at 136.91, which is the Fibonacci 38.2% retracement from the high of recent wave ‘b’ to the low of recent wave ‘c’.
The bullish case looks considerably stronger on a chart of the Dow Jones Industrial Average. We’ve posted that analysis on the public-facing side of our website for you to read. Also note we’re offering an especially nice subscription package in conjunction with the new year, and it’s still available for a few more days.
Twitter: @TradingOnMark
The authors may have a position in the mentioned securities at the time of publication. Any opinions expressed herein are solely those of the author, and do not in any way represent the views or opinions of any other person or entity.


: Showing Some Signs of Emerging Strength")
