The Russell 2000 ETF (NYSEArca: IWM) reached the higher targets we had identified here at See It Market in May, and there are signs it may be able to climb even farther.
However despite its apparent strength, the larger rally is probably nearing an end in a pattern similar to what we charted earlier this month for NASDAQ 100 futures.
For long-term position traders, the current area represents an attractive place to take profits. Traders operating on a faster time frame should note how the price of the ETF and the index behave near the Fibonacci-based resistance levels we have been tracking.
For example, after IWM climbed above resistance early this summer, it went back to test the area from above before proceeding in its rally. We may be seeing a similar event now with regard to the resistance at 170.20 that the fund recently overcame.
If the old resistance area holds as new support, then the next incremental target for the rally will be near 177.66, with 185.55 representing the next possible step beyond that.
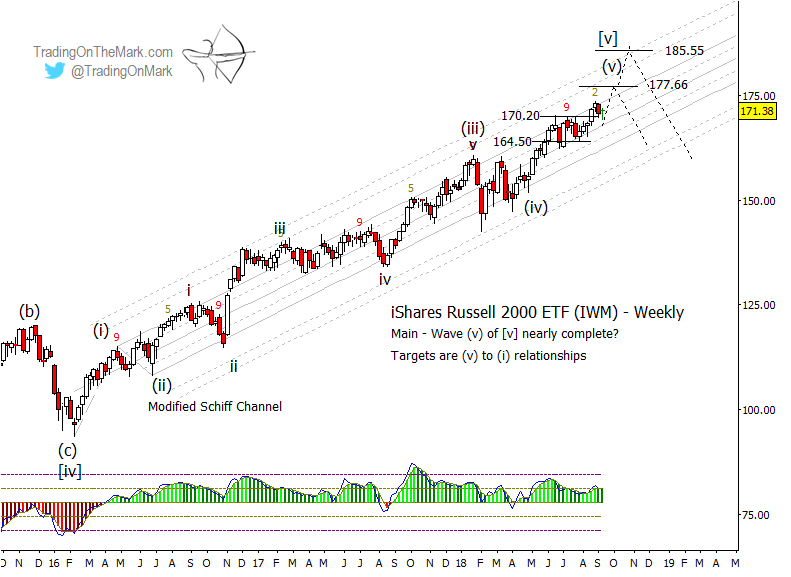
However the risk of failure increases with each upward step. We have been charting what may be almost complete Elliott wave counts in the major U.S. equity indices – the S&P 500, NASDAQ 100, and New York Composite Index in particular.
Meanwhile, we see divergences on the time span of months, where the Russell 2000, S&P 500, NASDAQ 100, and Wilshire 5000 are making higher highs while the Dow Jones 30 and New York Composite are lagging..
The divergences by themselves are not a bearish signal. Without additional information, big divergences across indices merely portend a breakout in one direction or the other. (For examples, note the behavior of major indices between spring 2011 and early 2012 and also between spring 2015 and autumn 2015.)
In the present case, the divergences are occurring while indices show potentially completed upward wave counts. It’s still premature to be bearish, but upward trades will carry less risk if traders treat resistance levels as “stepping stones” and are quick to take profits.
Trading On The Mark subscribers receive twice-daily updates for the Dollar Index, Euro futures, the S&P 500, crude oil, treasury bonds, and gold. If you’re new to TOTM, sign up to get our free newsletter and follow us on twitter to get timely updates for treasuries and other markets.
Twitter: @TradingOnMark
The authors may have a position in the mentioned securities at the time of publication. Any opinions expressed herein are solely those of the author, and do not in any way represent the views or opinions of any other person or entity.


