This post gives a quick update on NASDAQ 100 futures, which we believe are working through a long-term top formation.
In recent months, price has recognized each of the resistance levels we highlighted in our July post, with each level making for at least one weekly high.
The question now is how long will it continue to climb that ladder?
On a weekly time frame, the move up from the April wave (iv) low now meets the minimum requirement for the five sub-waves that should comprise terminal wave [v].
It is certainly possible that price can climb above nearby resistance at 7680 to test the next resistance level at 7790, but bullish traders should heed the warning that the rally could be near completion.
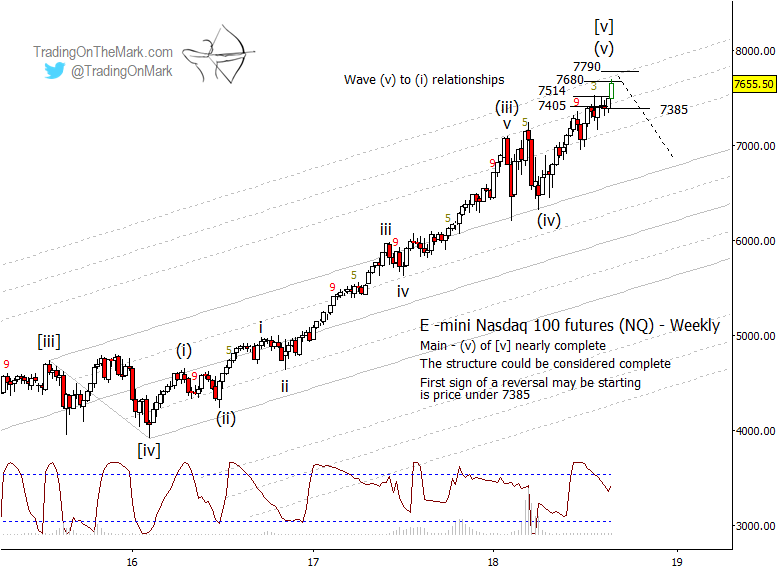
Initial confirmation that bears are taking control would be a weekly close beneath the Fibonacci 23.6% retracement support at 7385, which is also near prior resistance at 7405. A break beneath that area should lead to an eventual test of the main upper boundary of the upward-sloping channel shown on the chart above, perhaps near the 7000 area depending on time.
Beyond that point, we would look to the internal wave structure of a decline in order to project lower targets.
Keep in mind that initiating trades with the expectation of a market top is very risky. Even though analysis suggests areas where a major turn can happen, experience teaches that markets can sometimes run over those areas in an extended upward blow-off move. It is crucial to look for signals on your favored time frame that help confirm a change of trend. For example, on a weekly chart that confirmation might consist of a break of the major support level mentioned, followed by a successful retest of that level from beneath.
A break and retest of the harmonic lines of the upward channel could also serve as confirmation.
If this style of analysis is helpful in your trading, there are still a few days left to take advantage of our special summer offer. Get a whole year of charts with morning and evening updates at a deeply reduced price. Trading On The Mark posts twice-daily updates for the Dollar Index, Euro futures, the S&P 500, crude oil, treasury bonds, and gold.
Twitter: @TradingOnMark
The authors may have a position in the mentioned securities at the time of publication. Any opinions expressed herein are solely those of the author, and do not in any way represent the views or opinions of any other person or entity.

 Rolling Over At Key Fibonacci Level?")


