Today, we will provide a trading outlook for the NASDAQ 100 Index (INDEXNASDAQ:NDX), with implications for other ETFs like the PowerShares QQQ (NASDAQ:QQQ).
Slightly more than two weeks ago we forecasted a lift in equity shares and used the broad NYSE Composite Index to show upward potential.
All the major U.S. stock indices have been following the basic script, but the NASDAQ 100 Index has stood out.
It started the month at a relatively stronger position and is now reaching new highs. Can it climb higher?
We believe so but there are important resistance levels to watch nearby based on a Fibonacci relationship with the first segment – wave (i) – of the big climb from 2017. Either 7405 or 7514 could act as near-term resistance.
If NASDAQ futures can break solidly above 7514, then the next similar resistance levels near 7680 and 7790 becomes viable targets. Wave (v) could reach that high if its middle segment extends.
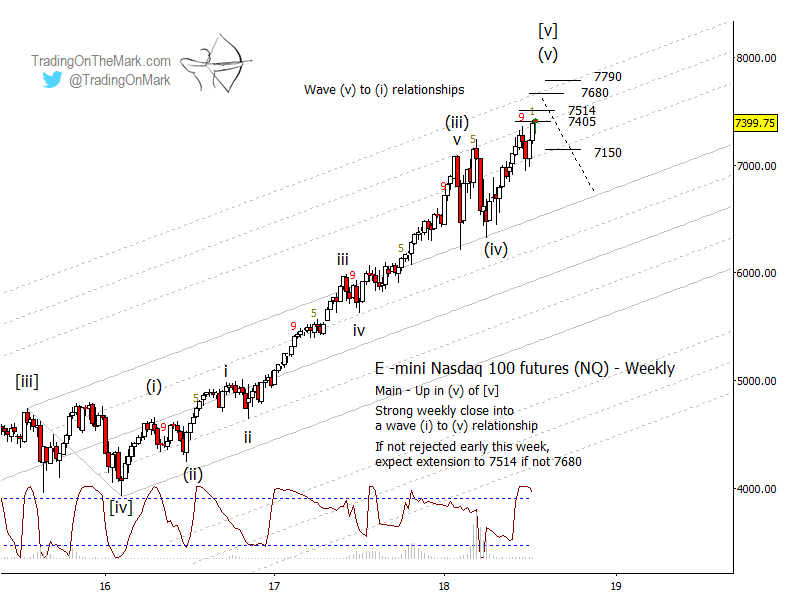 Keep in mind we believe the larger climb is nearly exhausted. From an Elliott wave perspective the impulsive form up from 2017 is complete. This summer the market should be putting the finishing touches on the big rally.
Consistent with the idea that the big rally is nearly complete, the large swings during the first months of 2018 had the characteristics of a fourth wave in a five-wave sequence. Wave (iv) had a corrective three-wave structure, and it tested and moved away from an important structural support – the main upper channel line in this case.
We wrote about the same wave (iv) correction in late March, when we used a chart of the Russell 2000 ETF to show the potential for an equity rally from that area. The rally came in as expected!
When equity bears eventually take control, the first sign of confirmation will be a break of prior resistance-turned-support. Right now the nearby level that qualifies is 7150. If price breaks beneath that level then the next target will be a test of the upper channel line that acted as support during the early months of 2018.
With morning and evening updates every trading day, Trading On The Mark offers charts and analysis on time frames ranging from weekly to intraday for the S&P 500, crude oil, the Euro, Dollar Index, treasury bonds, and gold. You can review the performance of many of our forecasts in our See It Market archive.
This summer, we’re making a special offer available for extra savings. Take out a year-long subscription to our Daily Analysis service and we’ll deduct the cost of three months of service. Basically you get a whole summer of charts for free! The coupon code to take advantage of this offer is “summer”.
Twitter: @TradingOnMark
The authors may have a position in the mentioned securities at the time of publication. Any opinions expressed herein are solely those of the author, and do not in any way represent the views or opinions of any other person or entity.


