On December 31st of last year, I penned an article about the 10 Year US Treasury Yield and how it was following commodities higher.
More importantly, I noted that resistance near 1 percent would be important to watch in early 2021. We could either break lower or “we could be looking at a bottoming formation that breaks out over 1 percent and runs up to 1.5 to 2.0 percent.”
Well, the breakout occurred and interest rates are now a major theme to watch this year. Today we provide a couple charts to reflect on this breakout.
Note that the following MarketSmith charts are built with Investors Business Daily’s product suite.
I am an Investors Business Daily (IBD) partner and promote the use of their products. The entire platform offers a good mix of technical and fundamental data and education.
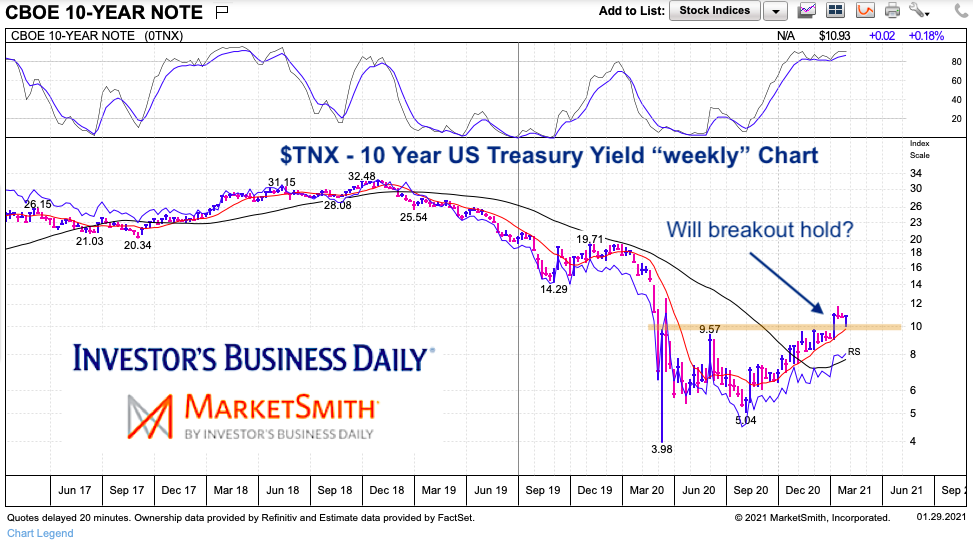
10 Year US treasury Yield “weekly” Chart
Here we can see the big picture. If the breakout hold, I think we could see yields rise to 1.5% and possibly higher.
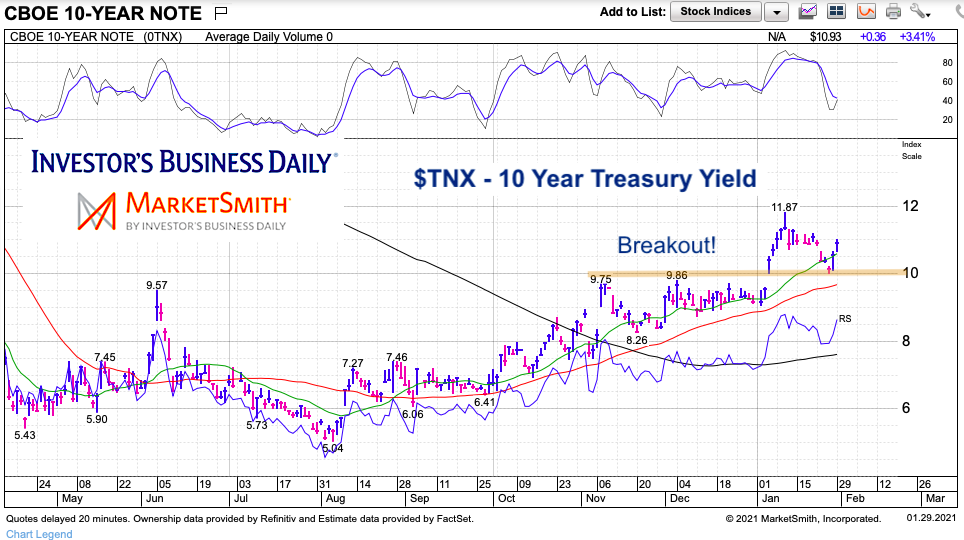
10 Year US treasury Yield “daily” Chart
The near-term view highlights the breakout. It would take a strong move under 1 percent to imply that this is a “fakeout”. The 10 year yield is a barometer for mortgage rates (and housing). Keep it on your radar.
Twitter: @andrewnyquist
The author may have a position in mentioned securities at the time of publication. Any opinions expressed herein are solely those of the author, and do not in any way represent the views or opinions of any other person or entity.
 Posts Strong Break Out!")


