Our previous two posts showed how the S&P 100 Index INDEXCBOE: OEX and the iShares Russell 2000 ETF NYSEARCA: IWM both appear to be tracing through the final moves of an upward elliott wave pattern.
The final move for these two stock market indices implies the fifth and final leg of what has been a very long climb.
Today we examine how the much broader NYSE Composite Index INDEXNYSEGIS: NYA is behaving in its Elliott wave run up to a potentially durable stock market high.
When we last charted the NYA in June, we cautioned traders against putting a bearish interpretation on the succession of lower highs that printed from January 2018, to September 2018, to April 2019.
We identified the zone from 12131 to 12203 as important support that was unlikely to break, and we also wrote:
“as of this weekend [June 7, 2019] it appears the index is recovering from slightly higher than that area. Potentially bullish traders shouldn’t rule out the possibility of another test lower, but it is not guaranteed to happen.”
In hindsight the bounce had already begun from a low of 12238, so the upward move favored the aggressive trader.
The price action in NYA after the June-July bounce behaved as a typical fourth wave, much like the S&P 100 did. It resolved in the upward direction as expected, and now we are watching for clues about how high the final fifth wave can reach.
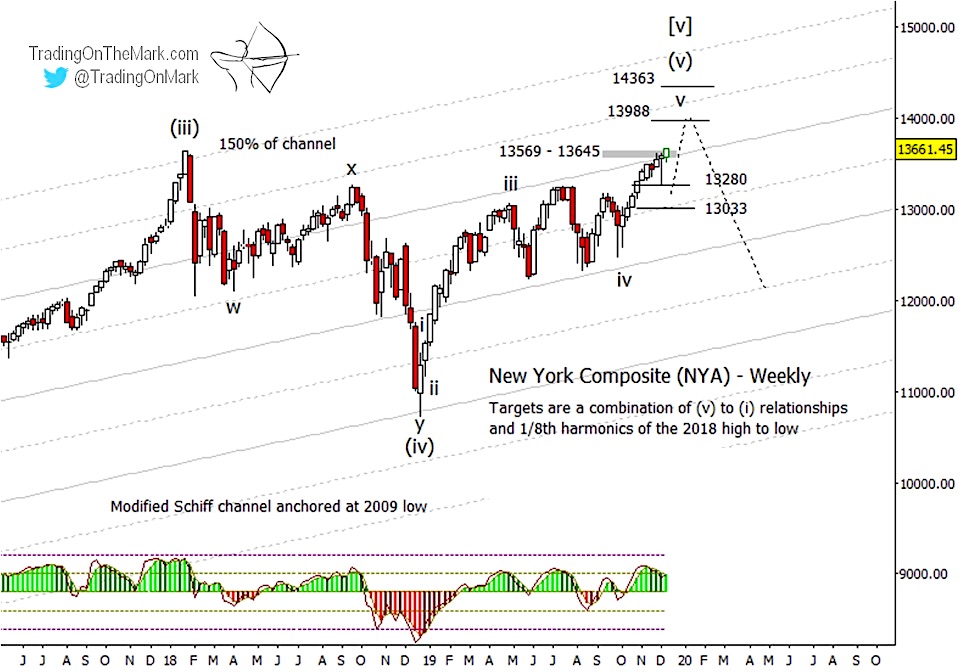
Forecasting a top precisely is risky, and we encourage readers not to interpret our charts that way. Instead it is better to view the current set of support and resistance levels as a ladder of obstacles.
For example, the strong resistance in the zone from 13569 to 13645 has already produced a retrace to the support target at 13280, and a deeper retrace to 13033 is still possible. If price succeeds in breaking above the gray resistance zone, then it should attempt to test as high as 13988, whereupon we would watch for indications about whether that level can be overcome. If so, then bulls might advance further to 14363.
It’s significant that the adaptive CCI index – our preferred momentum indicator – does not yet show the kind of negative divergence versus price that we would expect at a top.
It’s easier to find the trades when you start with the right charts. Right now you can get access to all the charts and lock in a deep 20% price reduction with the coupon code YULE.
Visit Trading On The Mark to see examples of our coverage of the Euro, the Dollar Index, gold, crude oil, bonds and the S&P 500 on weekly, daily and intraday time frames. We’re also rolling out a new feature that lets subscribers receive charts and posts by email.
Watch for our next post, which will examine how the Japanese Yen might on the verge of tricking a lot of bullish traders into making the wrong move.
Twitter: @TradingOnMark
The authors may have a position in the mentioned securities at the time of publication. Any opinions expressed herein are solely those of the author, and do not in any way represent the views or opinions of any other person or entity.


