November is historically a strong month for the S&P 500 (INDEXSP:.INX) and broader stock market. However, historical precedence has played little to no relevance in the financial markets in 2017.
With that caveat, here are five November stock market seasonality stats that we compiled over at Avory & Co. for November.
1. That last 6 Novembers have been positive, if November 2017 is also positive, this would be tied for the longest stretch in 50 years. (1977-1983)
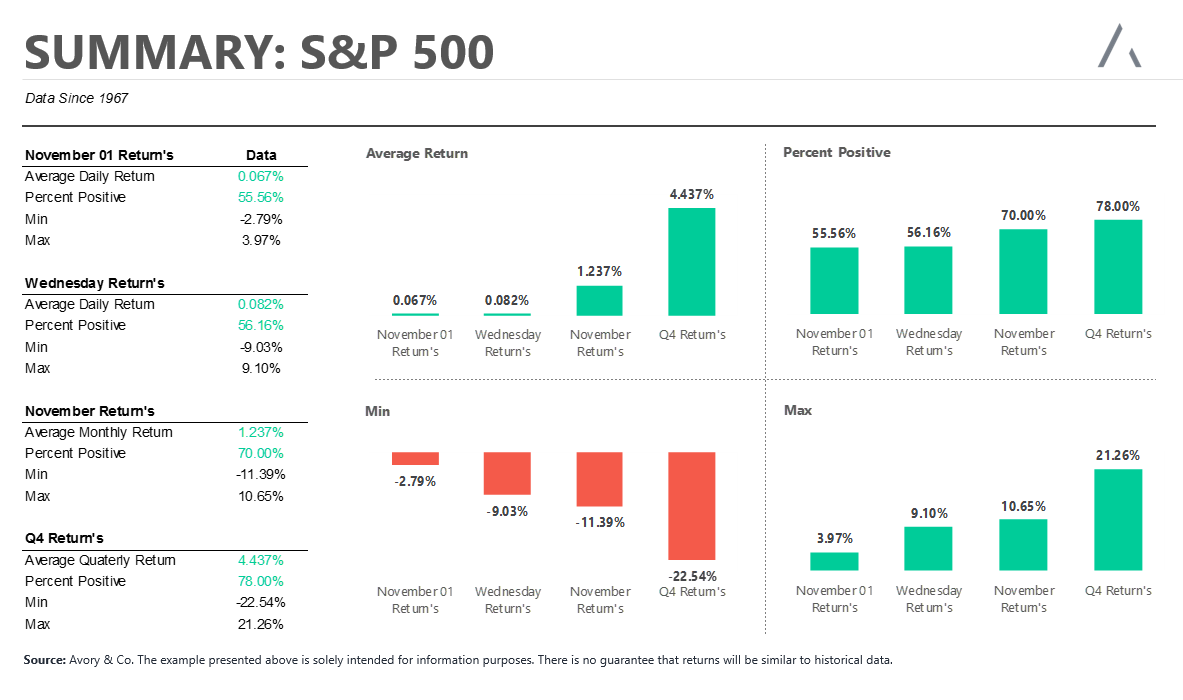
2. November is up historically 70% of the time.Tied for the 3rd best month.
3. The average return for November is +1.24%.
4. Only 7 days in November are historically positive less than 50% of the time. The lowest amount of any month.
5. The 24th of November is up 79% of the time on average. The 2nd highest reading of any day, with the highest reading being the day after Christmas (82.76%).
Twitter: @_SeanDavid
Any opinions expressed herein are solely those of the author, and do not in any way represent the views or opinions of any other person or entity.


")


 Ready To Break Out?")
