The price of natural gas is a closely watched economic input, similar to crude oil, gasoline, and interest rates.
When these economic inputs are rising, then we tend to worry about inflation. Today, we take a closer look at a long-term chart of natural gas.
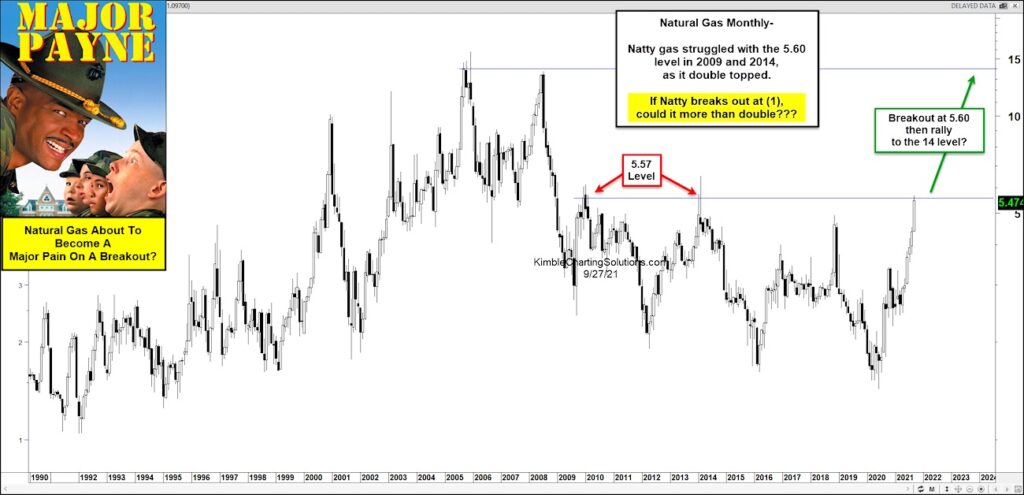
As you can see on today’s “monthly” chart, the price of natural gas has risen sharply of late. And Natty gas could become a major pain to consumers if its price continues to rise!
More specifically, natty gas struggled around the $5.60 mark in 2009 and 2014 while it formed a double top and declined sharply. breaks above this double top! Natty gas is testing this level as we speak and its next move may carry serious implications (for traders and consumers alike).
If natural gas can breakout above this level and hold, it could rally towards its old highs around the $14 level! On the flip side, if this level can hold and prices turn lower, then consumers will breath a sigh of relief! What happens next will be important… Stay tuned!
Note that KimbleCharting is offering a 2 week Free trial to See It Market readers. Just send me an email to services@kimblechartingsolutions.com for details to get set up.
Twitter: @KimbleCharting
Any opinions expressed herein are solely those of the author, and do not in any way represent the views or opinions of any other person or entity.

: Worrisome to Broader Market?")
