Just two weeks ago, I shared a breakout setup for Natural Gas and wondered, “Is It Time For Natural Gas ETF To Head Much Higher?”
That question is being answered this week, as the Natural Gas ETF (UNG) has surged and broken out to new multi-week highs.
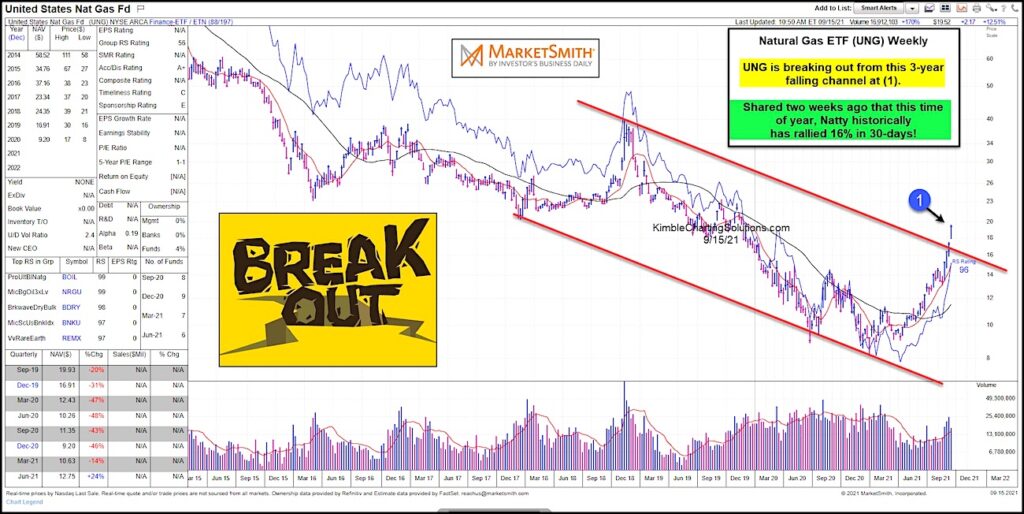
Today’s “weekly” chart is a follow up to our recent article. As you can see, UNG is breaking out from its 3-year falling channel at (1).
As mentioned two weeks ago (with UNG trading at $16), Natural Gas has historically rallied 16% during its September window. UNG is now trading at $20, or up $25%!
And by the looks of this chart, UNG could be headed higher yet! Stay tuned!
$UNG United States Natural Gas ETF “weekly” Chart
Note that KimbleCharting is offering a 2 week Free trial to See It Market readers. Just send me an email to services@kimblechartingsolutions.com for details to get set up.
Twitter: @KimbleCharting
Any opinions expressed herein are solely those of the author, and do not in any way represent the views or opinions of any other person or entity.

: Worrisome to Broader Market?")


