The past 15 years or so have seen Natural Gas mired in a down-trend. But Natural Gas prices are perking up and this has given life to the United States Natural Gas Fund ETF $UNG.
Today’s chart looks at a “weekly” chart of this Natural Gas ETF $UNG over the past 5 years.
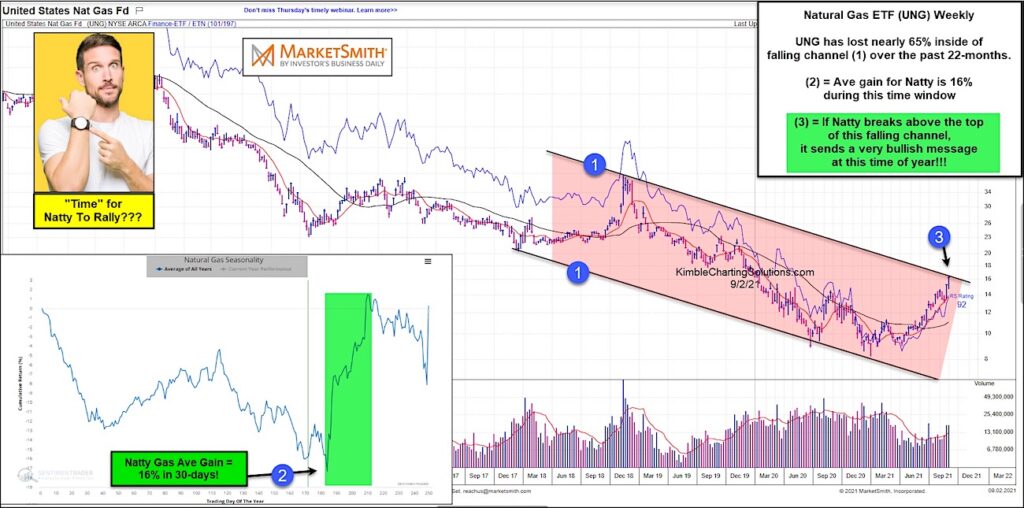
Zooming in, we can see that $UNG has been caught up in another trading downtrend over the past 22 months marked by each (1). During this time, the price of $UNG has fallen nearly 65%.
But prices have been rallying over the past several weeks and have $UNG testing the top of this falling price channel at (3).
This breakout test also comes at a time when Natural gas tends to perform well. Seasonality says the next 30 days yield an average gain of 16 percent at (2).
So if Natural Gas breaks out at (3), it should result in much higher prices. Stay tuned!
Natural Gas ETF $UNG “weekly” Chart
Note that KimbleCharting is offering a 2 week Free trial to See It Market readers. Just send me an email to services@kimblechartingsolutions.com for details to get set up.
Twitter: @KimbleCharting
Any opinions expressed herein are solely those of the author, and do not in any way represent the views or opinions of any other person or entity.


