A visit to the NASDAQ 100 ETF completes our recent tour of the major U.S. stock indices.
As with the other index funds we’ve covered, we’re watching for pattern completion in the Invesco QQQ Trust ETF (NASDAQ:QQQ).
The fund’s January performance was similar to that of the Dow ETF and the S&P 500 ETF in that it broke through nearby resistance levels. However unlike those funds, QQQ closed this week on a slightly lower high and appears poised to signal some negative momentum divergence as early as next week.
We continue to believe the Russell 2000 ETF is the better harbinger of what’s to come this spring. It has been unable even to retest its December high. However the Elliott wave patterns on weekly and daily time frames look clearer for the index funds that had the better performance, including QQQ, and all three of them look as though they are moving very close to completion of the big rally from 2022.
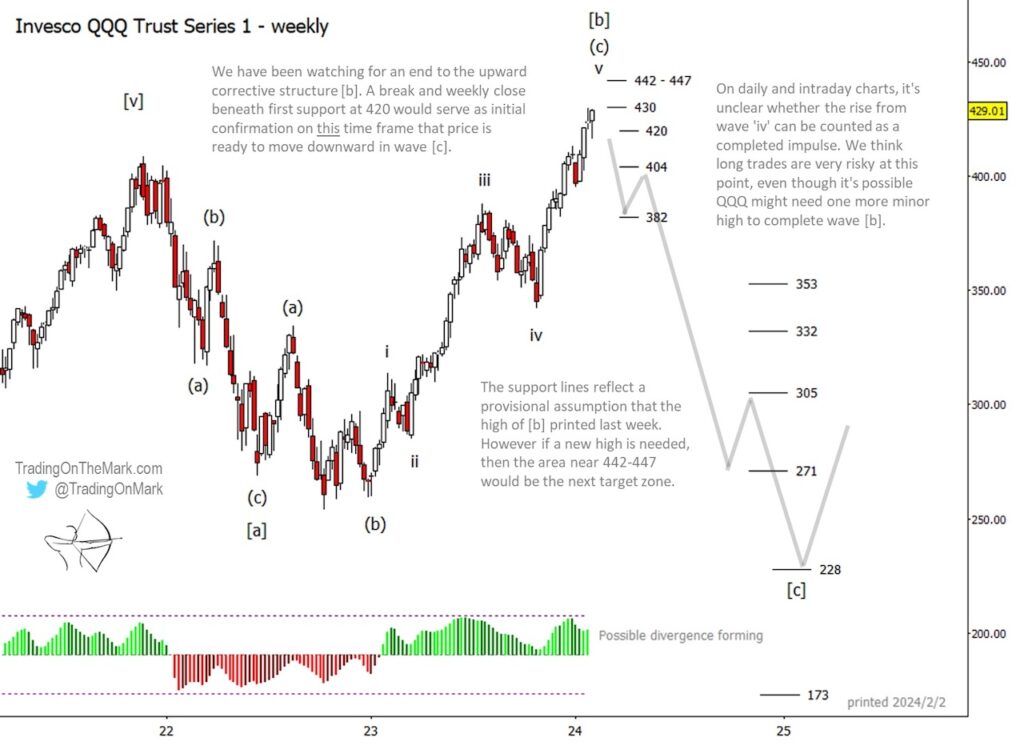
The trend in QQQ is still sharply upward, but at this point we believe long trades are quite risky on any time frame other than intraday. If price is able to break above Fibonacci-based resistance at 430, then the area near 442-447 would normally be the next target zone. In a different market environment we would be more confident in saying traders should play for the higher zone after an upward break.
Even so, there are not yet clear signals of market weakness in QQQ. The first sign that the upward pattern might be complete would be a weekly close beneath the important price line at 420. If bears are successful after that, we expect them to aim for 404 and 382 as next downward targets in a move that could comprise the first segment of a large downward impulse as drawn on the chart.
Eventually the downward impulse should reach to the vicinity of the 2022 low, with 271 and 228 standing out as prominent support targets for wave [c]. After that we might see a lengthy upward trend stretching into 2026 or later.
Trading On The Mark uses technical analysis to identify the trends and turns in intraday, daily and weekly markets for commodities, energy, currency, bonds and indices. Visit our website for more charts, and follow us on X for updates and special offers.
Twitter: @TradingOnMark
The authors may have a position in the mentioned securities at the time of publication. Any opinions expressed herein are solely those of the author, and do not in any way represent the views or opinions of any other person or entity.


