Of the indices we’ve covered this month, the S&P 500 ETF appears poised to eke out a minor new high above that of 2022. Meanwhile the Russell 2000 ETF representing more mid-cap stocks has fallen beneath the initial support level we mentioned. We think the Russell is the better harbinger of what’s to come.
This week we look at the SPDR Dow Jones Industrial Average ETF Trust (NYSEARCA:DIA), which has been the most exuberant of the major indices recently. DIA has already exceeded the 2022 high, but we expect it’s rising Elliott wave pattern will be contained by considerations similar to what we described last week for SPY.
The segment of most interest to traders working on a weekly time frame is the upward stretch from the October 2023 low, which we have labelled as wave (b) of [b]. The climb from that point should be an impulsive wave (c), and the nearly linear set of candles on the chart is consistent with an impulse. (The sub-waves within the impulse are clearer on a daily chart, not shown here.)
When impulsive sub-wave (c) of [b] is complete, the middle part of the entire corrective structure should also be complete and a downward reversal should commence.
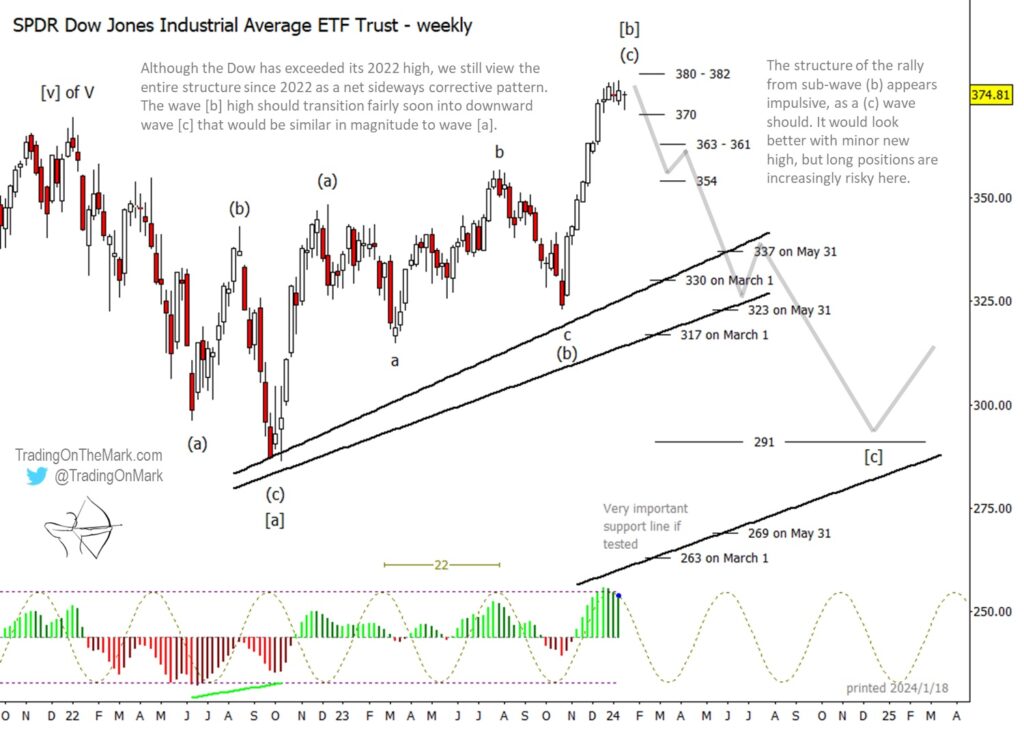
Right now sub-wave (c) would look better with a marginally higher high, perhaps reaching the resistance zone of 380-382. However we believe long positions at this point are really quite risky.
Sub-wave (c) can also be counted as possibly complete already on the daily time frame. It’s a matter of interpretation.
There is not yet any divergence between price and the momentum indicator on a weekly time frame, although if such a signal were to appear it would be useful to bears. We note there is divergence against momentum on a daily chart.
A break of support at 370 would serve as the initial indication that the downward reversal has begun. After that, we expect price to cascade and possibly bounce among the next support zones at 363-361 and 354.
The upward-sloping trendlines on the chart represent big-picture channel support. The precise level of support from the lines depends on timing, of course. We expect both of the upper lines to be noticed by the market, but a better target for downward wave [c] would be lower. The support level at 291 looks particularly attractive.
The lowest trendline on the chart represents the most important support of all the lines shown. A break and monthly close beneath it would be a significantly bearish signal. We think the line will probably hold if tested.
To kick off 2024 we’re offering an introductory special for new subscribers to receive our daily updates about equity indices, commodities, currencies and treasury bonds. Visit our website to learn the details and see a preview of our work.
Twitter: @TradingOnMark
The authors may have a position in the mentioned securities at the time of publication. Any opinions expressed herein are solely those of the author, and do not in any way represent the views or opinions of any other person or entity.

 Testing Important Price Support")
: Cup (and Maybe Handle) Watch")

