 Over the past few months, I’ve written several pieces on the Nasdaq 100’s outperformance and leadership position. And just last month, I wrote about the Nasdaq 100 breakout above 4000. That breakout helped lead the Dow Jones Industrial Average and S&P 500 to new highs. But lost in all the excitement is the technical understanding that most breakouts get tested… whether it be sooner or later (from my post on 8/19):
Now before we get too short-term bullish, it is important to realize that this breakout still requires confirmation. This can come in one of two ways: 1) The S&P 500 is still trading under its July highs, so new bulls want to see that index push to new highs. 2) The breakout level (3990/4000) will need to hold on any sort of retest / pullback. Failure to do so would be a near-term warning.
However, should the breakout hold, two potential Nasdaq 100 price targets include 4092 (1.618 Fibonacci Extension) and 4150 (a mirrored move higher).
That 1.618 Fib extension target (4092) came quickly… and without any meaningful retest of the breakout. It appears that time (and momentum) deferred the retest until now. Below is a Nasdaq 100 breakout chart that I posted on Twitter and StockTwits this morning (updated with today’s intraday candlestick).
Nasdaq 100 Daily Chart
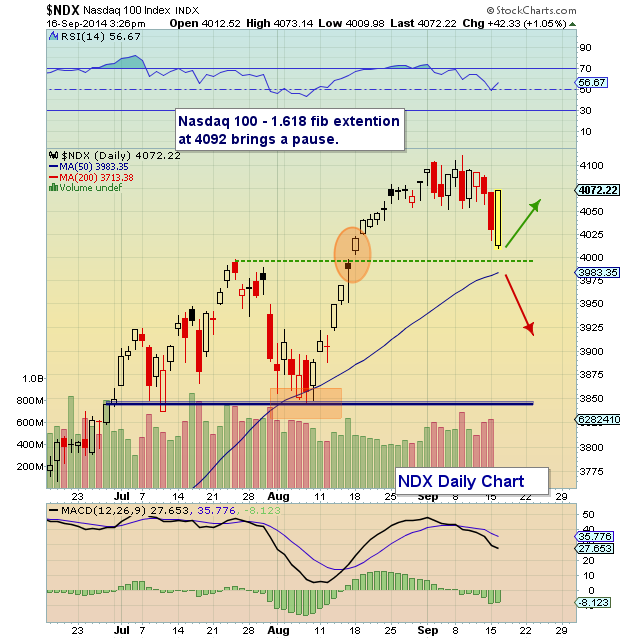
Note today’s candlestick (thus far). WOW. The Nasdaq 100 is set to completely retrace yesterday’s red candle. This would be a good sign that a successful retest is underway. But with several catalysts coming this week (Alibaba IPO, Scotland vote, the Fed, etc…), traders will want to stay focused and nimble. And the 4000 level on the Nasdaq 100 remains a major near-term technical support level.
A similar situation is developing on the Nasdaq 100 ETF, the Powershares QQQ Trust (QQQ). If interested, I covered the QQQ breakout at the end of August as well. Thanks for reading.
No position in any of the mentioned securities at the time of publication. Any opinions expressed herein are solely those of the author, and do not in any way represent the views or opinions of any other person or entity.

: Worrisome to Broader Market?")

