If by some cosmic accident the globe-engulfing wave of memetic market chatter about “record low volatility” hasn’t bombarded you yet, this post has you covered.
The erosion of volatility is weathering away at deeply buried strata of price and sentiment that haven’t been seen since before the Cambrian Explosion of VIX in 2008 that (somewhat dubiously) pressed it into the service of acting as the “fear index” so popularly obsessed-over today. After falling aggressively for several weeks the short-term implied volatility that VIX measures fell to a low last seen in February 2007.
Immediate-term historical volatility is almost extinct:
And the 10 day historical volatility of the SPX is down to 4.1% – can’t think of ever seeing it lower
— Chris McKhann (@volatrade) June 5, 2014
Using the VIX as a baseline, immediate term (next 2 weeks) implied volatility (IV) is tied with recent highs – moving roughly in lockstep with the S&P 500 (SPX) – while medium-term IV (~4 months) is chiseling away at the lows:
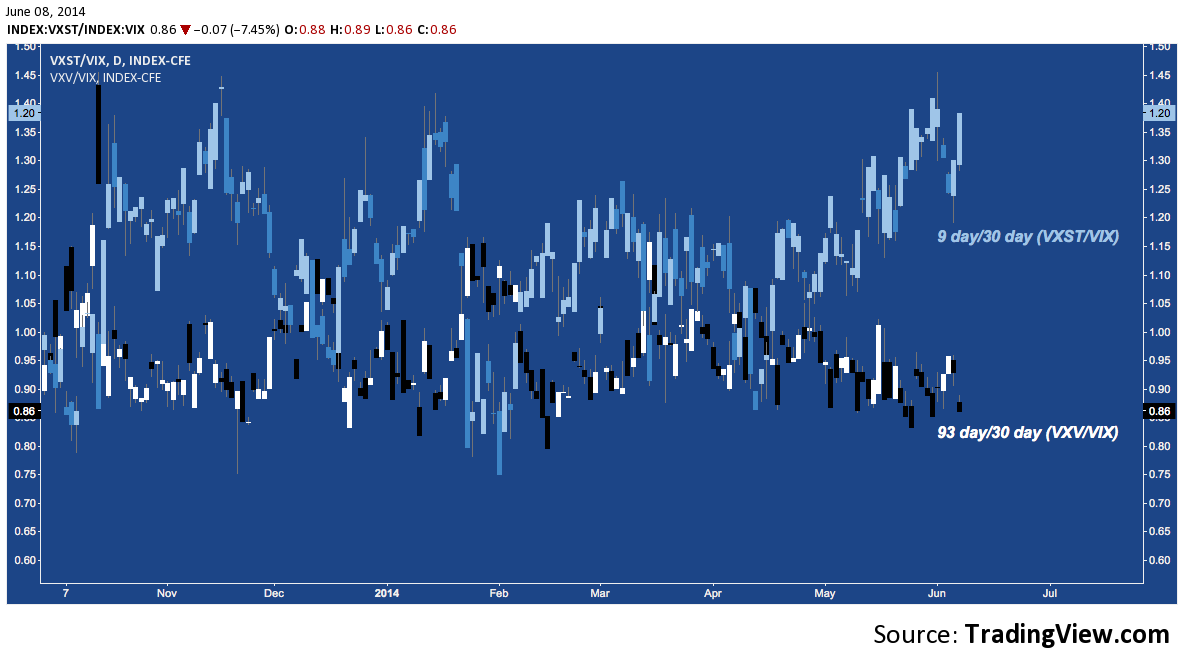
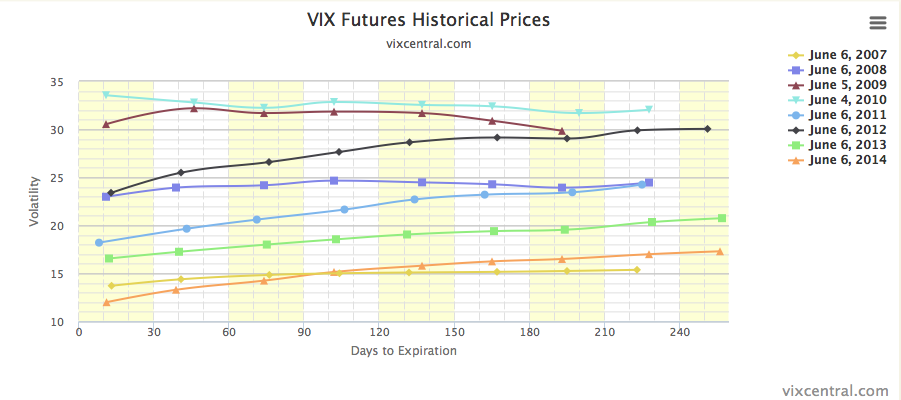
You can see a) how steeply in contango this 0-90 day slice of the term structure is (never a more savage environment to be long a volatility product for any significant duration, by the way) and b) how this window suggests appreciably lower implied volatility now versus the last time VIX was down here (i.e. in Spring 2007):
The VIX itself is now only negligibly off it’s all-time low:
20 trading days ago, $VIX was at 14.03. Closed today -23.5% from there at 10.73. All-time low: only -12.5% at 9.31 — Andrew Kassen (@andrewunknown) June 6, 2014
And as suggested in the chart above, the word “crushed” doesn’t begin to get at how beaten-down IV has become across the term structure:
The mid term VIX index (2008 inception) is at it’s all-time low at 14.87 @agwarner pic.twitter.com/RYg4cAHXDw — Jake (@EconomPic) June 6, 2014
It’s worth repeating: equities aren’t alone. The place of repose stocks have gone to is a mausoleum of moribund markets that extends beyond the Western world and it’s many bourses to venues both global (ICE) and parochial (e.g. Mongolia’s MSE). Many instruments – across every asset class – are digging aggressively into the bedrock conception of volatility that has acted as a baseline for global markets for years, for decades and forever. All things consider, the widely encompassing market quiescence of today goes beyond even 2005-2007.
Here’s where the standard caveats (no doubt familiar) are invoked.
- “Look at 1995; or 2006: implied volatility can stay this low and diverge from stocks for a long time”
- “Look at the mid-1990s: implied volatility can go up with asset prices”
Both demonstrate the very limited (and often destructively misleading) utility of viewing the VIX as the “fear index”. If anything, the VIX is an “uncertainty index” that ebbs and flows with the market’s relative assurance about future asset prices. The only real axiom that can be derived from the VIX is that certainty over future market direction is finite, fickle, and mean-reverting.
Q: Does near record low volatility beget even lower volatility going forward? Hint: Volatility is mean reverting. pic.twitter.com/suYIWDb3qV
— Charlie Bilello, CMT (@MktOutperform) June 8, 2014
That volatility is about to move higher is as close to certainty as the market will ever give you. But what that means for stocks just isn’t clear. The two major nadirs of implied volatility in the history of the VIX that precede today’s are clear on this point:
- The mid-1990s saw a dip in equity prices (SPX shed -9.73%) as the VIX bottomed below 10 in late 1993, followed by a multi-year regime where the S&P and VIX moved higher together, radically diverging only once (1998’s LTCM crisis/Russia’s default).
- In contrast, SPX moved higher in 2006-2007, adding +10.94% after VIX tagged its all-time low (opening at 8.6 on 12/18/2006) before installing October 2007’s high and shedding nearly 58% over the next 1.5 years.
History isn’t making this easy. What meager precedent it provides about this kind of environment seems to create a dichotomy for stocks suggesting an epic expansion or a vicious bear market could be next: 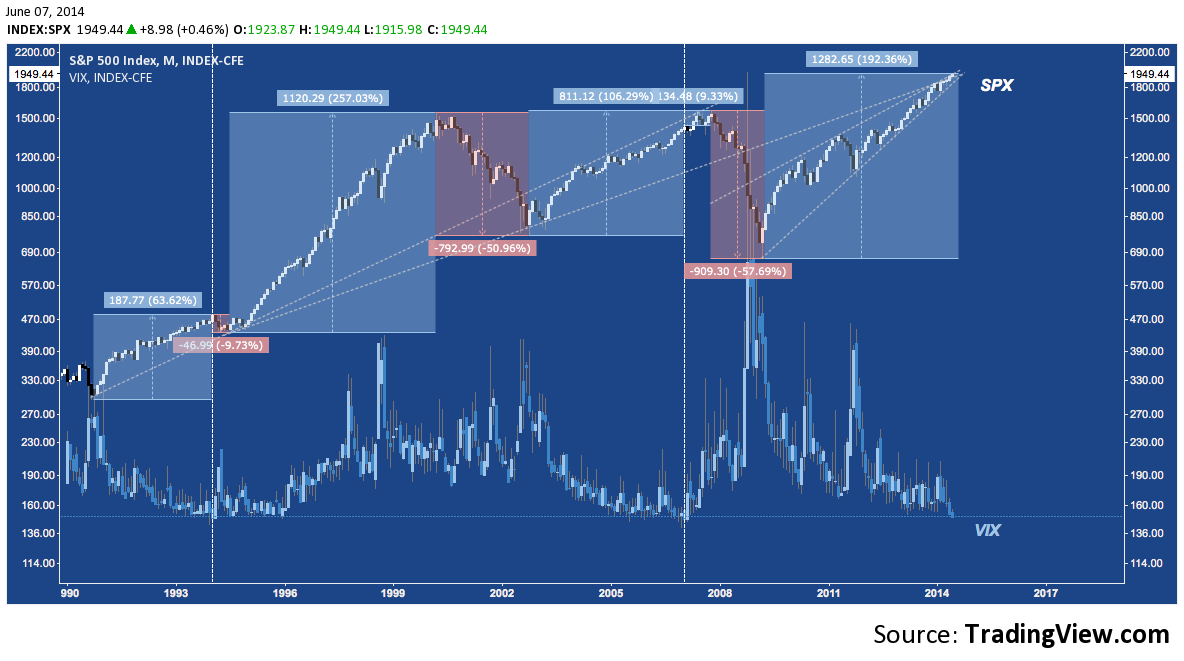 Arguments can be made about why this time favors one scenario versus the other. Pessimists might point out 1993’s IV low was preceded by a placid 38-month, +64% advance before it’s volatility whipsaw resolved through 1994’s correction into the epic 1995-2000 bull while 2014’s IV low (to date) comes on the heels of trend notably longer (64 months) and far stronger (+192%). Similarly, the S&P was 298 sessions into a streak of closes (that went to 363) above it’s 200-Day SMA when volatility bottomed in late 1993 v. 388 sessions currently. As Ryan Detrick pointed out a few days ago, only two streaks on the S&P have persisted longer, with second place set to fall to the current market in 7 sessions from now:
$SPY closed above 200-day MA for 385 days in a row. Only two streaks longer going back 40 yrs. https://stks.co/t0O8x — Ryan Detrick (@RyanDetrick) Jun. 2 at 05:38 PM
Realists will point out that these statistics prove that unprecedented outliers aren’t particularly rare: as complex systems that make a routine out of maximizing frustration across the greatest number of participants, financial markets have a native and even necessary disregard for what their own histories say “ought” to be possible. Why can’t the current trend continue much longer? After all, 1996-1998’s 525-session streak was inconceivable: until it happened. Prudence not only demands that we acknowledge this is possible as we manage risk, but that we take care to avoid the dangerous process of market acculturation through which outliers become mundane.
The VIX is sending one signal here and it isn’t 1) stocks are about to scream higher or 2) drop off into a yawning hole of wealth destruction. This fantastically loud and popular but false dichotomy crowds out it’s unassuming message: that something unexpected is about to happen. In most market contexts, that’s a painfully obvious and entirely useless observation; but to the majority of the market that is complicit in today’s totalizing volatility crash, it’s fast becoming a staggering revelation.
Twitter: @andrewunknown and @seeitmarket


: Showing Some Signs of Emerging Strength")
